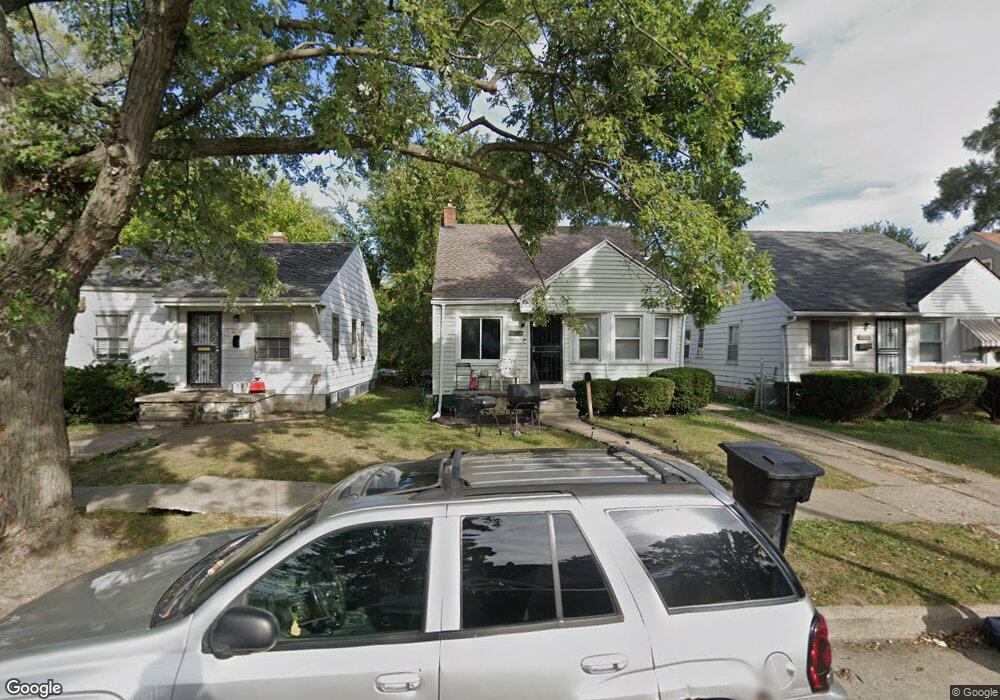
19180 Algonac St Detroit, MI 48234
Pulaski NeighborhoodEstimated Value: $38,000 - $66,000
--
Bed
1
Bath
800
Sq Ft
$69/Sq Ft
Est. Value
About This Home
This home is located at 19180 Algonac St, Detroit, MI 48234 and is currently estimated at $55,528, approximately $69 per square foot. 19180 Algonac St is a home located in Wayne County with nearby schools including Casimir Pulaski Elementary-Middle School, Edward 'Duke' Ellington Conservatory of Music and Art, and Charles L. Spain Elementary-Middle School.
Ownership History
Date
Name
Owned For
Owner Type
Purchase Details
Closed on
Nov 16, 2012
Sold by
Wayne County Treasurer
Bought by
Howard Deborah L
Current Estimated Value
Purchase Details
Closed on
Mar 1, 2006
Sold by
Be Kheng
Bought by
Lambert Christopher
Purchase Details
Closed on
May 10, 2004
Sold by
Mortgage Electronic Registration Systems
Bought by
Federal National Mortgage Association
Purchase Details
Closed on
Jun 24, 2003
Sold by
Fannie Mae
Bought by
Be Kheng
Purchase Details
Closed on
Jun 4, 2003
Sold by
Grillo Alessandro and Grillo Maria
Bought by
Mortgage Electronic Registration Systems
Purchase Details
Closed on
Aug 30, 2001
Sold by
Golden Key Corp
Bought by
Grillo Alessandro
Purchase Details
Closed on
Apr 19, 2000
Sold by
Principal Residential Mt
Bought by
Hud
Purchase Details
Closed on
Mar 15, 2000
Sold by
Byrd Lisa Y
Bought by
Principal Residential Mtg Inc
Create a Home Valuation Report for This Property
The Home Valuation Report is an in-depth analysis detailing your home's value as well as a comparison with similar homes in the area
Home Values in the Area
Average Home Value in this Area
Purchase History
| Date | Buyer | Sale Price | Title Company |
|---|---|---|---|
| Howard Deborah L | $1,850 | None Available | |
| Lambert Christopher | $70,000 | Enterprise Title Solutions | |
| Federal National Mortgage Association | -- | Greco | |
| Be Kheng | $37,000 | Greco | |
| Mortgage Electronic Registration Systems | $75,281 | -- | |
| Grillo Alessandro | $70,000 | -- | |
| Hud | -- | -- | |
| Principal Residential Mtg Inc | $33,270 | -- |
Source: Public Records
Tax History Compared to Growth
Tax History
| Year | Tax Paid | Tax Assessment Tax Assessment Total Assessment is a certain percentage of the fair market value that is determined by local assessors to be the total taxable value of land and additions on the property. | Land | Improvement |
|---|---|---|---|---|
| 2025 | $946 | $22,900 | $0 | $0 |
| 2024 | $946 | $20,300 | $0 | $0 |
| 2023 | $917 | $16,000 | $0 | $0 |
| 2022 | $972 | $13,600 | $0 | $0 |
| 2021 | $948 | $11,100 | $0 | $0 |
| 2020 | $948 | $8,000 | $0 | $0 |
| 2019 | $989 | $9,200 | $0 | $0 |
| 2018 | $877 | $8,300 | $0 | $0 |
| 2017 | $154 | $8,100 | $0 | $0 |
| 2016 | $1,192 | $12,600 | $0 | $0 |
| 2015 | $1,260 | $12,600 | $0 | $0 |
| 2013 | $1,744 | $17,444 | $0 | $0 |
| 2010 | -- | $25,575 | $778 | $24,797 |
Source: Public Records
Map
Nearby Homes
- 19135 Teppert St
- 19367 Algonac St
- 19422 Algonac St
- 18925 Runyon St
- 18694 Beland St
- 18696 Gruebner St
- 18709 Runyon St
- 19331 Hoover St
- 19389 Hoover St
- 5130 E Outer Dr
- 19640 Hoover St
- 19337 Annott St
- 19160 Annott St
- 5727 E Outer Dr
- 18457 Hoover St
- 8291 E Brentwood St
- 19118 Dresden St
- 8346 Sirron St
- 19353 Strasburg St
- 19145 Strasburg St
- 19190 Algonac St
- 19174 Algonac St
- 19196 Algonac St
- 19166 Algonac St
- 19202 Algonac St
- 19160 Algonac St
- 19201 Beland St
- 19210 Algonac St
- 19185 Beland St
- 19177 Beland St
- 19197 Beland St
- 19163 Beland St
- 19167 Beland St
- 19189 Algonac St
- 19179 Algonac St
- 19216 Algonac St
- 19148 Algonac St
- 19165 Beland St
- 19197 Algonac St
- 19169 Algonac St