1919 Francisco St Unit 1919 Berkeley, CA 94709
North Berkeley NeighborhoodEstimated Value: $746,000 - $1,082,000
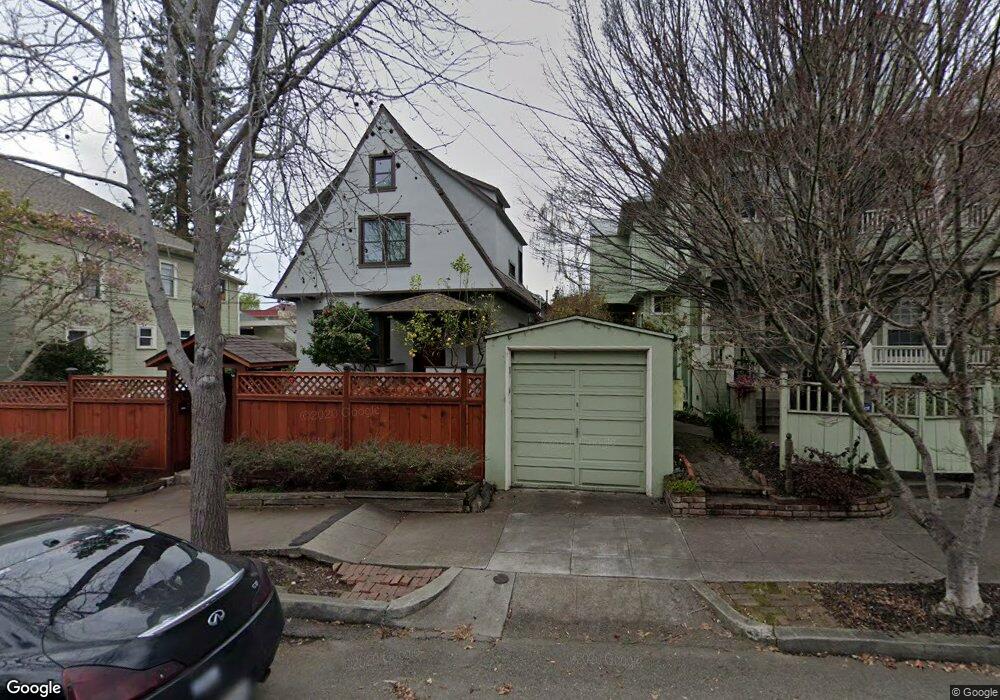
About This Home
This home is located at 1919 Francisco St Unit 1919, Berkeley, CA 94709 and is currently estimated at $907,833, approximately $632 per square foot. 1919 Francisco St Unit 1919 is a home located in Alameda County with nearby schools including Berkeley Arts Magnet at Whittier School, Washington Elementary School, and Oxford Elementary School.
Ownership History
Purchase Details
Home Financials for this Owner
Home Financials are based on the most recent Mortgage that was taken out on this home.Purchase Details
Home Financials for this Owner
Home Financials are based on the most recent Mortgage that was taken out on this home.Purchase Details
Home Financials for this Owner
Home Financials are based on the most recent Mortgage that was taken out on this home.Purchase Details
Home Values in the Area
Average Home Value in this Area
Purchase History
We collect this data history from publicly available records. To have your information removed, we recommend requesting removal directly through your county’s website.
| Date | Buyer | Sale Price | Title Company |
|---|---|---|---|
| Ward Drew | -- | First American Title Ins Co | |
| Ward Drew | -- | Chicago Title Company | |
| Ward James | $279,000 | First American Title Guarant | |
| Wang Lawrence | $274,000 | First American Title Guarant |
Mortgage History
We collect this data history from publicly available records. To have your information removed, we recommend requesting removal directly through your county’s website.
| Date | Status | Borrower | Loan Amount |
|---|---|---|---|
| Open | Ward Drew | $270,000 | |
| Closed | Ward Drew | $226,000 | |
| Closed | Ward James | $179,000 |
Tax History
| Year | Tax Paid | Tax Assessment Tax Assessment Total Assessment is a certain percentage of the fair market value that is determined by local assessors to be the total taxable value of land and additions on the property. | Land | Improvement |
|---|---|---|---|---|
| 2025 | $7,073 | $436,873 | $133,162 | $310,711 |
| 2024 | $7,073 | $428,172 | $130,551 | $304,621 |
| 2023 | $6,920 | $426,640 | $127,992 | $298,648 |
| 2022 | $6,788 | $411,275 | $125,482 | $292,793 |
| 2021 | $6,796 | $403,074 | $123,022 | $287,052 |
| 2020 | $6,427 | $405,871 | $121,761 | $284,110 |
| 2019 | $6,166 | $397,914 | $119,374 | $278,540 |
| 2018 | $6,058 | $390,114 | $117,034 | $273,080 |
| 2017 | $5,833 | $382,466 | $114,740 | $267,726 |
| 2016 | $5,635 | $374,968 | $112,490 | $262,478 |
| 2015 | $5,558 | $369,336 | $110,801 | $258,535 |
| 2014 | $5,516 | $362,103 | $108,631 | $253,472 |
Map
- 1906 Delaware St
- 1733 Milvia St
- 1609 Bonita Ave Unit 5
- 2015 Hearst Ave
- 1545 Josephine St
- 1720 Hearst Ave
- 1511 Grant St
- 1643 Walnut St
- 1841 Vine St
- 1837 Addison St
- 1682 Oxford St
- 1425 Martin Luther King jr Way
- 2201 Virginia St Unit 2
- 1429 Edith St
- 1734 Spruce St
- 1616 Francisco St
- 2112 Mckinley Ave Unit D
- 1744 Addison St
- 1732 University Ave
- 1408 Henry St
- 1917 Francisco St Unit 1917
- 1915 Francisco St Unit 1915
- 1913 Francisco St
- 1909 Francisco St
- 1927 Francisco St
- 1914 Virginia St
- 1711 Martin Luther King jr Way
- 1918 Virginia St
- 1910 Virginia St
- 1920 Francisco St
- 1717 Mlk jr Way Unit 1721
- 1713 Martin Luther King jr Way Unit . B
- 1713 Martin Luther King jr Way Unit . B - Avail 8/1/
- 1713 Martin Luther King jr Way
- 1908 Virginia St
- 1709 Martin Luther King jr Way
- 1908 Francisco St
- 1928-1920 Francisco St
- 1922 Francisco St
- 1933 Francisco St
Ask me questions while you tour the home.