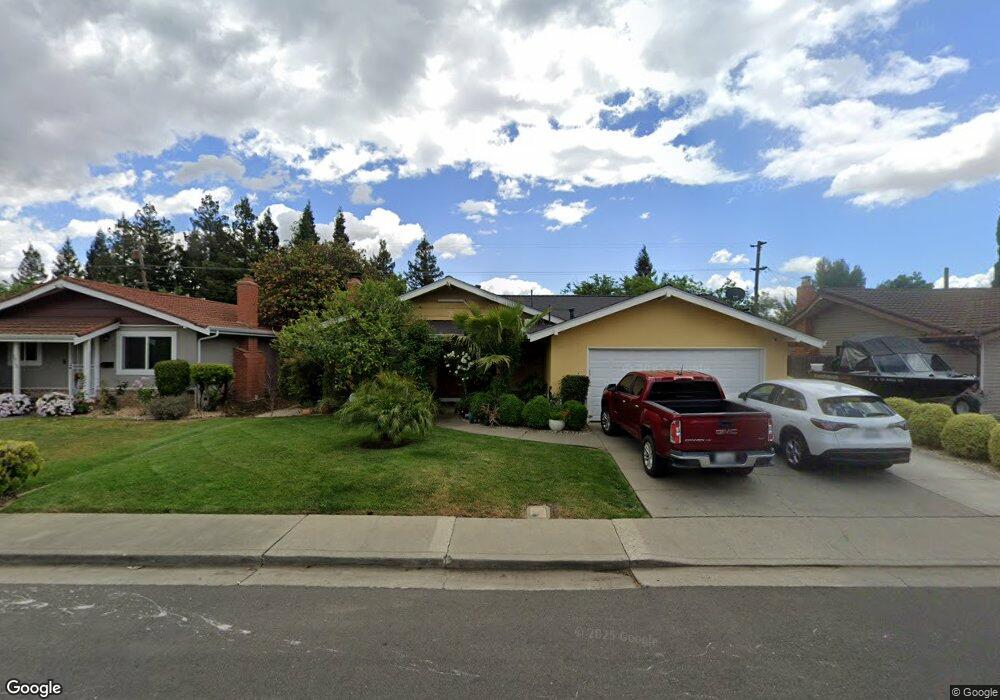
1919 Minnesota St Fairfield, CA 94533
Estimated Value: $460,000 - $494,000
3
Beds
2
Baths
1,399
Sq Ft
$344/Sq Ft
Est. Value
About This Home
This home is located at 1919 Minnesota St, Fairfield, CA 94533 and is currently estimated at $481,288, approximately $344 per square foot. 1919 Minnesota St is a home located in Solano County with nearby schools including Fairview Elementary School, Crystal Middle School, and Armijo High School.
Ownership History
Date
Name
Owned For
Owner Type
Purchase Details
Closed on
Aug 29, 2012
Sold by
Bell Gail C
Bought by
Rote Simon E and Rote Cindy D
Current Estimated Value
Purchase Details
Closed on
Mar 23, 2005
Sold by
Bell Gail C and Bell Gail
Bought by
Bell Gail C
Home Financials for this Owner
Home Financials are based on the most recent Mortgage that was taken out on this home.
Original Mortgage
$266,250
Interest Rate
5.7%
Mortgage Type
New Conventional
Purchase Details
Closed on
May 21, 2001
Sold by
Mann Anita
Bought by
Bell Gail
Home Financials for this Owner
Home Financials are based on the most recent Mortgage that was taken out on this home.
Original Mortgage
$155,700
Interest Rate
7.06%
Purchase Details
Closed on
May 11, 2001
Sold by
Hudson Mary N
Bought by
Bell Gail and Mann Anita
Home Financials for this Owner
Home Financials are based on the most recent Mortgage that was taken out on this home.
Original Mortgage
$155,700
Interest Rate
7.06%
Create a Home Valuation Report for This Property
The Home Valuation Report is an in-depth analysis detailing your home's value as well as a comparison with similar homes in the area
Home Values in the Area
Average Home Value in this Area
Purchase History
| Date | Buyer | Sale Price | Title Company |
|---|---|---|---|
| Rote Simon E | $87,000 | Old Republic Title Company | |
| Bell Gail C | -- | Fidelity Title Co | |
| Bell Gail | -- | Fidelity National Title Co | |
| Bell Gail | $195,000 | Fidelity National Title Co |
Source: Public Records
Mortgage History
| Date | Status | Borrower | Loan Amount |
|---|---|---|---|
| Previous Owner | Bell Gail C | $266,250 | |
| Previous Owner | Bell Gail | $155,700 | |
| Closed | Bell Gail | $29,200 |
Source: Public Records
Tax History Compared to Growth
Tax History
| Year | Tax Paid | Tax Assessment Tax Assessment Total Assessment is a certain percentage of the fair market value that is determined by local assessors to be the total taxable value of land and additions on the property. | Land | Improvement |
|---|---|---|---|---|
| 2025 | $1,220 | $107,000 | $30,779 | $76,221 |
| 2024 | $1,220 | $104,903 | $30,176 | $74,727 |
| 2023 | $1,184 | $102,847 | $29,585 | $73,262 |
| 2022 | $1,169 | $100,831 | $29,006 | $71,825 |
| 2021 | $1,158 | $98,855 | $28,438 | $70,417 |
| 2020 | $1,132 | $97,842 | $28,147 | $69,695 |
| 2019 | $1,104 | $95,925 | $27,596 | $68,329 |
| 2018 | $1,139 | $94,045 | $27,055 | $66,990 |
| 2017 | $1,088 | $92,202 | $26,525 | $65,677 |
| 2016 | $1,071 | $90,395 | $26,005 | $64,390 |
| 2015 | $1,001 | $89,038 | $25,615 | $63,423 |
| 2014 | $992 | $87,295 | $25,114 | $62,181 |
Source: Public Records
Map
Nearby Homes
- 1842 Minnesota St
- 1661 Minnesota St
- 1007 4th St
- 1731 Michigan St
- 1200 Truman St
- 1443 Minnesota St
- 1625 Park Ln Unit 11
- 1042 Hayes St
- 109 Creek View Cir
- 113 Creek View Cir
- 1412 Hawaii St
- 2635 Alvarado Ct Unit 3
- 3418 Astoria Ct
- 2724 Toland Dr
- 1024 Tyler St
- 1032 Tyler St
- 1944 Diamond Way
- 266 De Soto Dr
- 1737 Kearny Ct
- 435 Hamilton Dr
- 1913 Minnesota St
- 1925 Minnesota St
- 1907 Minnesota St
- 1964 New Jersey St
- 1912 Minnesota St
- 1901 Minnesota St
- 1937 Minnesota St
- 1960 New Jersey St
- 1001 Warren St
- 1969 New Jersey St
- 1965 New Jersey St
- 1873 Minnesota St
- 1007 Warren St
- 1956 New Jersey St
- 1961 New Jersey St
- 1867 Minnesota St
- 1013 Warren St
- 1957 New Jersey St
- 1948 New Jersey St
- 1000 Warren St