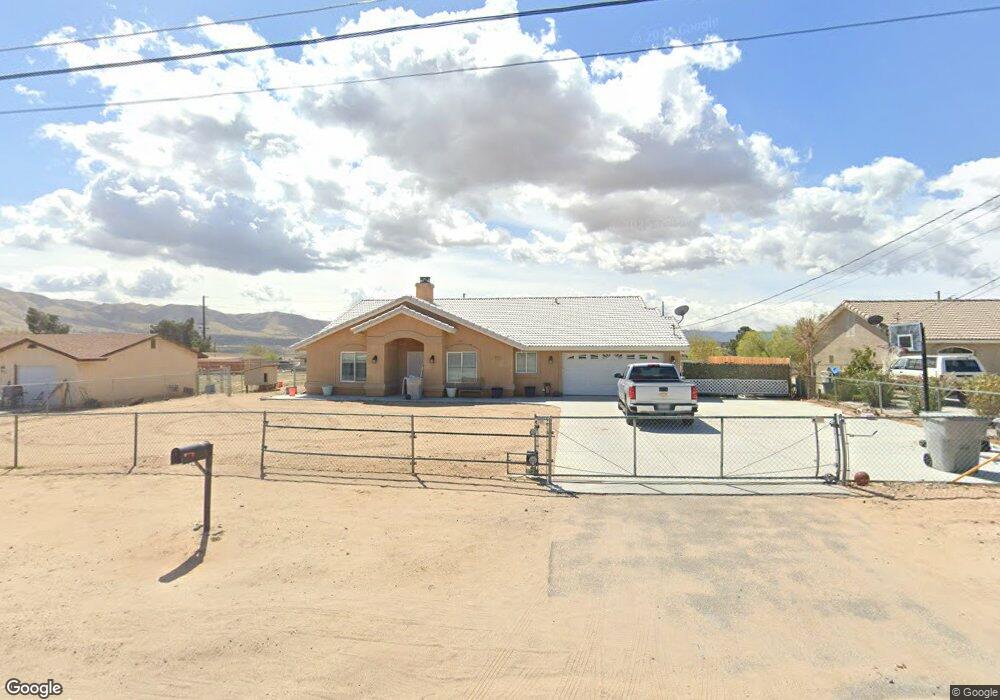
19193 Yucca St Hesperia, CA 92345
Estimated Value: $454,055 - $591,000
4
Beds
2
Baths
1,823
Sq Ft
$279/Sq Ft
Est. Value
About This Home
This home is located at 19193 Yucca St, Hesperia, CA 92345 and is currently estimated at $508,014, approximately $278 per square foot. 19193 Yucca St is a home located in San Bernardino County with nearby schools including Carmel Elementary School, Ranchero Middle School, and Sultana High School.
Ownership History
Date
Name
Owned For
Owner Type
Purchase Details
Closed on
Jan 24, 2018
Sold by
Marsh Jeffrey
Bought by
Chaffin Christopher L and Chaffin Diane R
Current Estimated Value
Home Financials for this Owner
Home Financials are based on the most recent Mortgage that was taken out on this home.
Original Mortgage
$216,000
Outstanding Balance
$182,748
Interest Rate
3.95%
Mortgage Type
New Conventional
Estimated Equity
$325,266
Purchase Details
Closed on
May 6, 2008
Sold by
Cfs Inc
Bought by
Marsh Jeffrey and Lopez Jody
Home Financials for this Owner
Home Financials are based on the most recent Mortgage that was taken out on this home.
Original Mortgage
$216,601
Interest Rate
5.87%
Mortgage Type
FHA
Purchase Details
Closed on
Nov 19, 2007
Sold by
Homeworks Development
Bought by
Cfs Inc
Purchase Details
Closed on
May 9, 2006
Sold by
Spence Helen E
Bought by
Homeworks Development
Home Financials for this Owner
Home Financials are based on the most recent Mortgage that was taken out on this home.
Original Mortgage
$275,200
Interest Rate
6.66%
Mortgage Type
Construction
Create a Home Valuation Report for This Property
The Home Valuation Report is an in-depth analysis detailing your home's value as well as a comparison with similar homes in the area
Home Values in the Area
Average Home Value in this Area
Purchase History
| Date | Buyer | Sale Price | Title Company |
|---|---|---|---|
| Chaffin Christopher L | $270,000 | Ticor Title Company Of Calif | |
| Marsh Jeffrey | $220,000 | First American Title Company | |
| Cfs Inc | -- | Chicago Title Company | |
| Homeworks Development | $120,000 | Fidelity National Title Co |
Source: Public Records
Mortgage History
| Date | Status | Borrower | Loan Amount |
|---|---|---|---|
| Open | Chaffin Christopher L | $216,000 | |
| Previous Owner | Marsh Jeffrey | $216,601 | |
| Previous Owner | Homeworks Development | $275,200 |
Source: Public Records
Tax History Compared to Growth
Tax History
| Year | Tax Paid | Tax Assessment Tax Assessment Total Assessment is a certain percentage of the fair market value that is determined by local assessors to be the total taxable value of land and additions on the property. | Land | Improvement |
|---|---|---|---|---|
| 2025 | $3,357 | $307,214 | $61,443 | $245,771 |
| 2024 | $3,357 | $301,190 | $60,238 | $240,952 |
| 2023 | $3,320 | $295,284 | $59,057 | $236,227 |
| 2022 | $3,243 | $289,494 | $57,899 | $231,595 |
| 2021 | $3,184 | $283,818 | $56,764 | $227,054 |
| 2020 | $3,147 | $280,908 | $56,182 | $224,726 |
| 2019 | $3,082 | $275,400 | $55,080 | $220,320 |
| 2018 | $2,796 | $253,970 | $68,572 | $185,398 |
| 2017 | $2,418 | $222,600 | $29,300 | $193,300 |
| 2016 | $2,234 | $206,100 | $27,100 | $179,000 |
| 2015 | $2,063 | $190,000 | $25,000 | $165,000 |
| 2014 | $1,782 | $162,200 | $32,200 | $130,000 |
Source: Public Records
Map
Nearby Homes
- 0 Rock Springs Rd Unit HD25231516
- 8944 Glendale Ave
- 19223 Rocksprings Rd
- 0 Glendale Ave Unit HD25103572
- 0 Glendale Ave Unit HD25103550
- 9022 Glendale Ave
- 19158 Live Oak St
- 19077 Goleta St
- 19095 Madrone St
- 19101 Live Oak St
- 19019 Madrone St
- 19261 Centennial St
- 9164 Quincy Ave
- 9193 Piedra Ave
- 19242 Monterey St
- 18994 Vine St
- 19180 Monterey St
- 19255 Hinton St
- 0 Pinnacle St
- 19146 Hinton St
- 19211 Yucca St
- 19179 Yucca St
- 19194 Rocksprings Rd
- 19182 Rocksprings Rd
- 19182 Goleta St
- 19214 Rocksprings Rd
- 19214 Rock Springs Rd
- 19225 Yucca St
- 19163 Yucca St
- 19164 Rocksprings Rd
- 19230 Rocksprings Rd
- 0 Rock Springs Rd Unit CV17033394
- 0 Rock Springs Rd Unit CRIV24113359
- 0 Rock Springs Rd Unit IV24113359
- 0 Rock Springs Rd Unit RS23137472
- 0 Rock Springs Rd Unit HD22236911
- 0 Rock Springs Rd Unit IV20248277
- 0 Rock Springs Rd Unit 521827
- 0 Rock Springs Rd Unit 403244
- 0 Rock Springs Rd Unit 417811