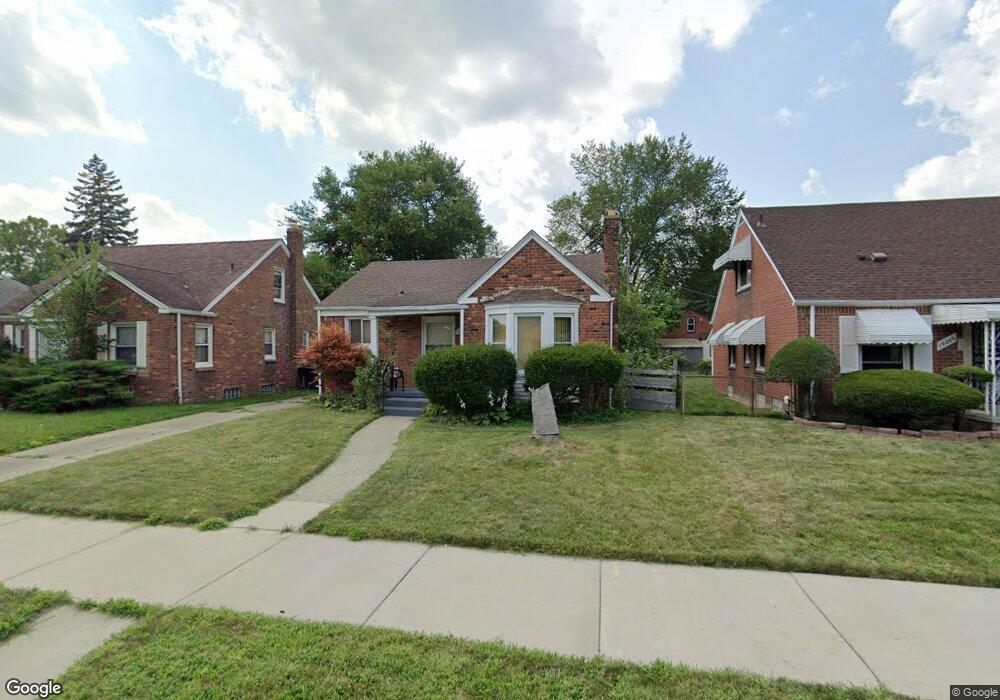
19199 Fielding St Detroit, MI 48219
Evergreen Lahser NeighborhoodEstimated Value: $46,000 - $119,000
2
Beds
1
Bath
886
Sq Ft
$96/Sq Ft
Est. Value
About This Home
This home is located at 19199 Fielding St, Detroit, MI 48219 and is currently estimated at $84,794, approximately $95 per square foot. 19199 Fielding St is a home located in Wayne County with nearby schools including Ralph W. Emerson Elementary-Middle School, Charles L. Spain Elementary-Middle School, and Edward 'Duke' Ellington Conservatory of Music and Art.
Ownership History
Date
Name
Owned For
Owner Type
Purchase Details
Closed on
Jan 4, 2008
Sold by
Federal Home Loan Mortgage Corporation
Bought by
Trimble Anthony D
Current Estimated Value
Purchase Details
Closed on
Aug 29, 2007
Sold by
Dandridge Horace
Bought by
Federal Home Loan Mortgage Corporation
Purchase Details
Closed on
Oct 7, 2004
Sold by
The Chase Manhattan Bank
Bought by
Reo 2 Go Llc
Home Financials for this Owner
Home Financials are based on the most recent Mortgage that was taken out on this home.
Original Mortgage
$36,800
Interest Rate
5.78%
Mortgage Type
Purchase Money Mortgage
Purchase Details
Closed on
Oct 22, 2003
Sold by
Muckle Emmanuel and Muckle Tracy M
Bought by
The Chase Manhattan Bank and Painewebber Mortgage Acceptance Corp Iv
Purchase Details
Closed on
Apr 17, 2003
Sold by
Muckle Emmanuel and Muckle Tracey M
Bought by
Advance Equities Ltd
Purchase Details
Closed on
Dec 15, 1995
Sold by
Bralen Inc
Bought by
Bralen Inc
Create a Home Valuation Report for This Property
The Home Valuation Report is an in-depth analysis detailing your home's value as well as a comparison with similar homes in the area
Home Values in the Area
Average Home Value in this Area
Purchase History
| Date | Buyer | Sale Price | Title Company |
|---|---|---|---|
| Trimble Anthony D | $17,400 | Attorneys Title | |
| Federal Home Loan Mortgage Corporation | $85,500 | None Available | |
| Reo 2 Go Llc | $46,000 | Attorneys Title Agency Llc | |
| The Chase Manhattan Bank | $48,750 | -- | |
| Advance Equities Ltd | $15,353 | -- | |
| Bralen Inc | $12,500 | -- |
Source: Public Records
Mortgage History
| Date | Status | Borrower | Loan Amount |
|---|---|---|---|
| Previous Owner | Reo 2 Go Llc | $36,800 |
Source: Public Records
Tax History Compared to Growth
Tax History
| Year | Tax Paid | Tax Assessment Tax Assessment Total Assessment is a certain percentage of the fair market value that is determined by local assessors to be the total taxable value of land and additions on the property. | Land | Improvement |
|---|---|---|---|---|
| 2025 | $1,063 | $43,900 | $0 | $0 |
| 2024 | $1,063 | $38,300 | $0 | $0 |
| 2023 | $1,032 | $30,200 | $0 | $0 |
| 2022 | $1,096 | $22,500 | $0 | $0 |
| 2021 | $1,068 | $18,000 | $0 | $0 |
| 2020 | $1,067 | $16,200 | $0 | $0 |
| 2019 | $1,052 | $12,800 | $0 | $0 |
| 2018 | $930 | $11,700 | $0 | $0 |
| 2017 | $166 | $11,300 | $0 | $0 |
| 2016 | $1,014 | $10,200 | $0 | $0 |
| 2015 | $1,020 | $10,200 | $0 | $0 |
| 2013 | $1,271 | $12,713 | $0 | $0 |
| 2010 | -- | $18,639 | $1,045 | $17,594 |
Source: Public Records
Map
Nearby Homes
- 19126 Patton St
- 18995 Fielding St
- 19411 Kentfield St
- 19013 Vaughan St
- 19515 Patton St
- 18961 Pierson St
- 18968 Vaughan St
- 18557 Fielding St
- 19830 W 7 Mile Rd
- 19700 Braile St
- 19363 Plainview Ave
- 19736 Stout St
- 18550 Pierson St
- 18997 Plainview Ave
- 18905 Evergreen Rd
- 18903 Evergreen Rd
- 19719 Vaughan St
- 19468 Evergreen Rd
- 20509 W Seven Mile Rd
- 18510 Heyden St
- 19191 Fielding St
- 19209 Fielding St
- 19179 Fielding St
- 19210 Patton St
- 19190 Patton St
- 19171 Fielding St
- 19182 Patton St
- 19196 Fielding St
- 19303 Fielding St
- 19186 Fielding St
- 19186 Fielding St
- 19210 Fielding St
- 19168 Patton St
- 19180 Fielding St
- 19161 Fielding St
- 19300 Patton St
- 19168 Fielding St
- 19309 Fielding St
- 19162 Patton St
- 19300 Fielding St