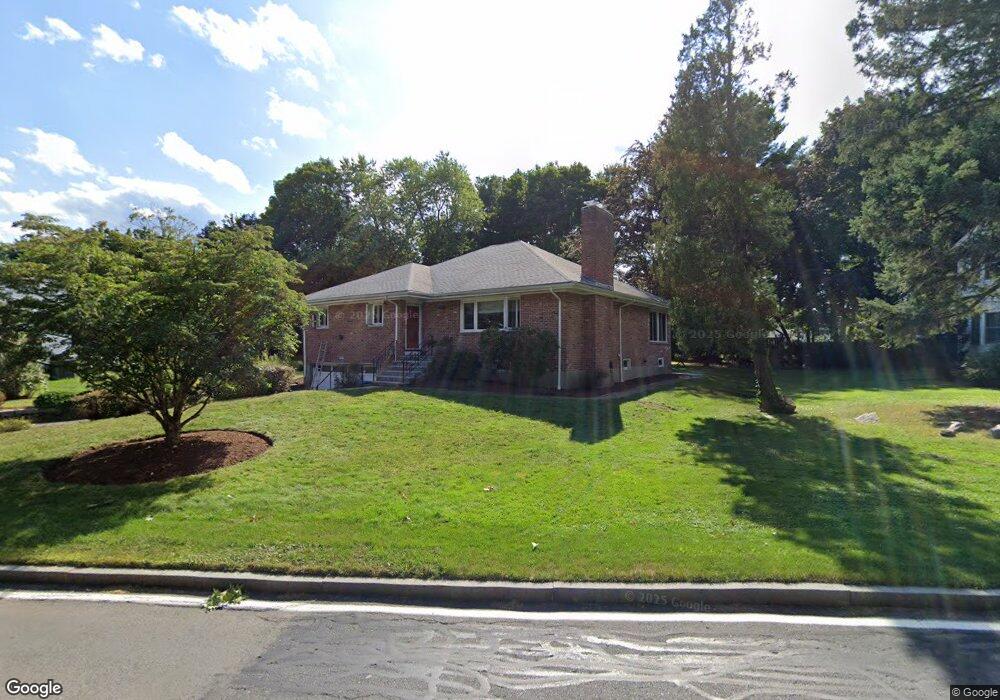
192 Bacon St Natick, MA 01760
Estimated Value: $966,127 - $1,114,000
3
Beds
2
Baths
1,904
Sq Ft
$542/Sq Ft
Est. Value
About This Home
This home is located at 192 Bacon St, Natick, MA 01760 and is currently estimated at $1,032,532, approximately $542 per square foot. 192 Bacon St is a home located in Middlesex County with nearby schools including Natick High School, Wilson Middle School, and Bennett-Hemenway (Ben-Hem) Elementary School.
Ownership History
Date
Name
Owned For
Owner Type
Purchase Details
Closed on
Jun 27, 2024
Sold by
Harnish Eric R and Harnish Jennifer D
Bought by
Eric R & J D Harnish Ft and Harnish
Current Estimated Value
Purchase Details
Closed on
Dec 31, 2003
Sold by
Raider Ethel A Est and Zaltas
Bought by
Harnish Eric R and Harnish Jennifer D
Home Financials for this Owner
Home Financials are based on the most recent Mortgage that was taken out on this home.
Original Mortgage
$333,700
Interest Rate
5.86%
Mortgage Type
Purchase Money Mortgage
Create a Home Valuation Report for This Property
The Home Valuation Report is an in-depth analysis detailing your home's value as well as a comparison with similar homes in the area
Home Values in the Area
Average Home Value in this Area
Purchase History
| Date | Buyer | Sale Price | Title Company |
|---|---|---|---|
| Eric R & J D Harnish Ft | -- | None Available | |
| Harnish Eric R | $445,000 | -- | |
| Harnish Eric R | $445,000 | -- |
Source: Public Records
Mortgage History
| Date | Status | Borrower | Loan Amount |
|---|---|---|---|
| Previous Owner | Harnish Eric R | $218,262 | |
| Previous Owner | Harnish Eric R | $225,886 | |
| Previous Owner | Harnish Eric R | $333,700 |
Source: Public Records
Tax History
| Year | Tax Paid | Tax Assessment Tax Assessment Total Assessment is a certain percentage of the fair market value that is determined by local assessors to be the total taxable value of land and additions on the property. | Land | Improvement |
|---|---|---|---|---|
| 2025 | $9,743 | $814,600 | $487,200 | $327,400 |
| 2024 | $9,482 | $773,400 | $461,600 | $311,800 |
| 2023 | $9,237 | $730,800 | $429,700 | $301,100 |
| 2022 | $8,928 | $669,300 | $387,800 | $281,500 |
| 2021 | $8,592 | $631,300 | $367,400 | $263,900 |
| 2020 | $8,176 | $600,700 | $336,800 | $263,900 |
| 2019 | $7,635 | $600,700 | $336,800 | $263,900 |
| 2018 | $6,787 | $520,100 | $306,200 | $213,900 |
| 2017 | $6,512 | $482,700 | $272,700 | $210,000 |
| 2016 | $6,320 | $465,700 | $257,700 | $208,000 |
| 2015 | $6,202 | $448,800 | $257,700 | $191,100 |
Source: Public Records
Map
Nearby Homes
- 36 Winnemay St
- 20 Florence St Unit B
- 16 Harvard St
- 7 Jackson Ct Unit B
- 52 Washington St
- 23 Lake St
- 9 Bellevue Rd
- 27 2nd St
- 53 Harvard Street Extension
- 3 Vale St Unit A
- 45 Summer St
- 49 Summer St
- 293 Bacon St Unit A
- 34 Marion St
- 3 Wilson St Unit 3B
- 4B Lincoln St Unit 4B
- 3A Wilson St Unit 3A
- 6A Lincoln St Unit 6A
- 67 E Central St & 5 Union St
- 10 Lincoln St Unit 10
Your Personal Tour Guide
Ask me questions while you tour the home.