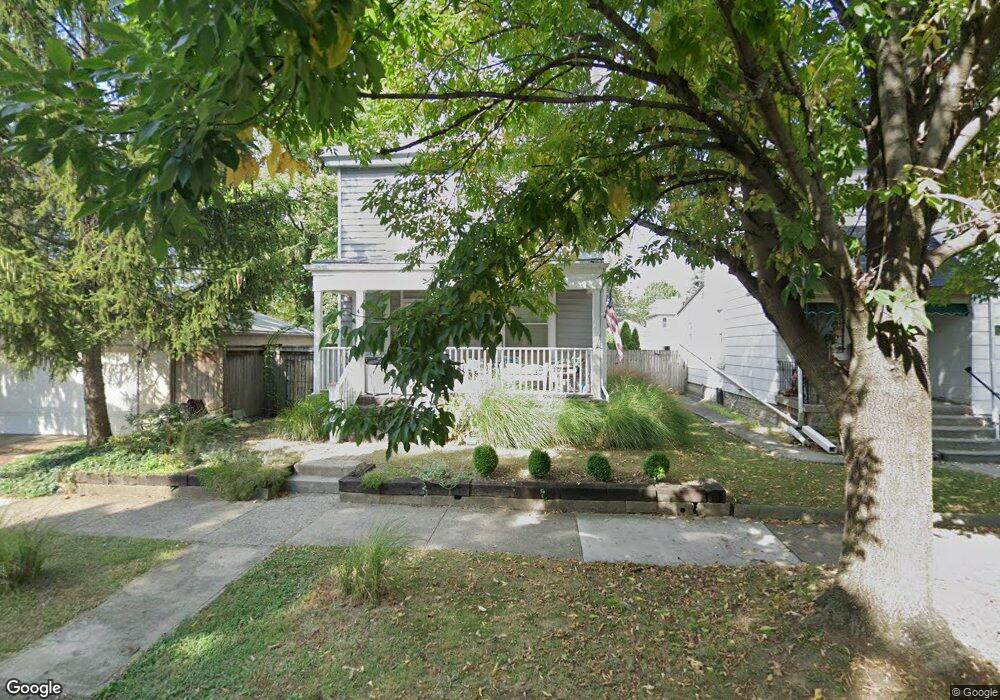
192 E Gates St Columbus, OH 43206
Merion Village NeighborhoodEstimated Value: $376,554 - $451,000
3
Beds
2
Baths
1,478
Sq Ft
$280/Sq Ft
Est. Value
About This Home
This home is located at 192 E Gates St, Columbus, OH 43206 and is currently estimated at $413,139, approximately $279 per square foot. 192 E Gates St is a home located in Franklin County with nearby schools including Siebert Elementary School, South High School, and South Columbus Preparatory Academy.
Ownership History
Date
Name
Owned For
Owner Type
Purchase Details
Closed on
Jul 15, 2003
Sold by
Hamm Sheila J
Bought by
Dillon Michael K and Dillon Ticia
Current Estimated Value
Home Financials for this Owner
Home Financials are based on the most recent Mortgage that was taken out on this home.
Original Mortgage
$184,000
Outstanding Balance
$72,553
Interest Rate
4.75%
Mortgage Type
Purchase Money Mortgage
Estimated Equity
$340,586
Purchase Details
Closed on
Aug 16, 1994
Sold by
Hunt Edward J
Bought by
Sheila Hamm
Home Financials for this Owner
Home Financials are based on the most recent Mortgage that was taken out on this home.
Original Mortgage
$63,350
Interest Rate
8.62%
Mortgage Type
FHA
Purchase Details
Closed on
Nov 16, 1993
Purchase Details
Closed on
Sep 21, 1993
Create a Home Valuation Report for This Property
The Home Valuation Report is an in-depth analysis detailing your home's value as well as a comparison with similar homes in the area
Home Values in the Area
Average Home Value in this Area
Purchase History
| Date | Buyer | Sale Price | Title Company |
|---|---|---|---|
| Dillon Michael K | $184,000 | -- | |
| Sheila Hamm | $64,000 | -- | |
| -- | $47,600 | -- | |
| -- | -- | -- |
Source: Public Records
Mortgage History
| Date | Status | Borrower | Loan Amount |
|---|---|---|---|
| Open | Dillon Michael K | $184,000 | |
| Closed | Sheila Hamm | $63,350 |
Source: Public Records
Tax History
| Year | Tax Paid | Tax Assessment Tax Assessment Total Assessment is a certain percentage of the fair market value that is determined by local assessors to be the total taxable value of land and additions on the property. | Land | Improvement |
|---|---|---|---|---|
| 2025 | $5,427 | $120,930 | $46,590 | $74,340 |
| 2024 | $5,427 | $120,930 | $46,590 | $74,340 |
| 2023 | $5,358 | $120,925 | $46,585 | $74,340 |
| 2022 | $4,678 | $90,200 | $43,750 | $46,450 |
| 2021 | $4,687 | $90,200 | $43,750 | $46,450 |
| 2020 | $4,693 | $90,200 | $43,750 | $46,450 |
| 2019 | $4,151 | $68,430 | $43,750 | $24,680 |
| 2018 | $4,195 | $68,430 | $43,750 | $24,680 |
| 2017 | $4,414 | $68,430 | $43,750 | $24,680 |
| 2016 | $4,679 | $70,640 | $23,980 | $46,660 |
| 2015 | $4,248 | $70,640 | $23,980 | $46,660 |
| 2014 | $4,258 | $70,640 | $23,980 | $46,660 |
| 2013 | $1,910 | $64,225 | $21,805 | $42,420 |
Source: Public Records
Map
Nearby Homes
- 154-156 E Gates St
- 247-249 Thurman Ave
- 169 Thurman Ave Unit 169
- 259 Thurman Ave
- 320 E Mithoff St
- 165 Frebis Ave
- 332 E Mithoff St
- 326 Frebis Ave
- 1366 S 4th St
- 6 Hanford St Unit 6
- 395 E Deshler Ave
- 1264 S High St
- 1373 S 4th St
- 348-350 E Moler St
- 273 Sheldon Ave
- 407 Hanford St Unit 409
- 272 E Jenkins Ave
- 1361 City Park Ave
- 273 Reinhard Ave
- 354 Sheldon Ave
- 1214 Jaeger St Unit 216
- 200 E Gates St
- 206 E Gates St Unit 208
- 178 E Gates St
- 176 E Gates St Unit 178
- 210 E Gates St
- 199 E Mithoff St
- 203 E Mithoff St
- 172 E Gates St
- 209 E Mithoff St
- 214 E Gates St Unit 216
- 214-216 E Gates St
- 195 E Mithoff St Unit 195
- 193 E Mithoff St Unit 193
- 193 E Mithoff St Unit 1
- 211 E Mithoff St
- 185 E Mithoff St
- 168 E Gates St
- 189 E Gates St Unit 191
- 183 E Gates St Unit 185
Your Personal Tour Guide
Ask me questions while you tour the home.