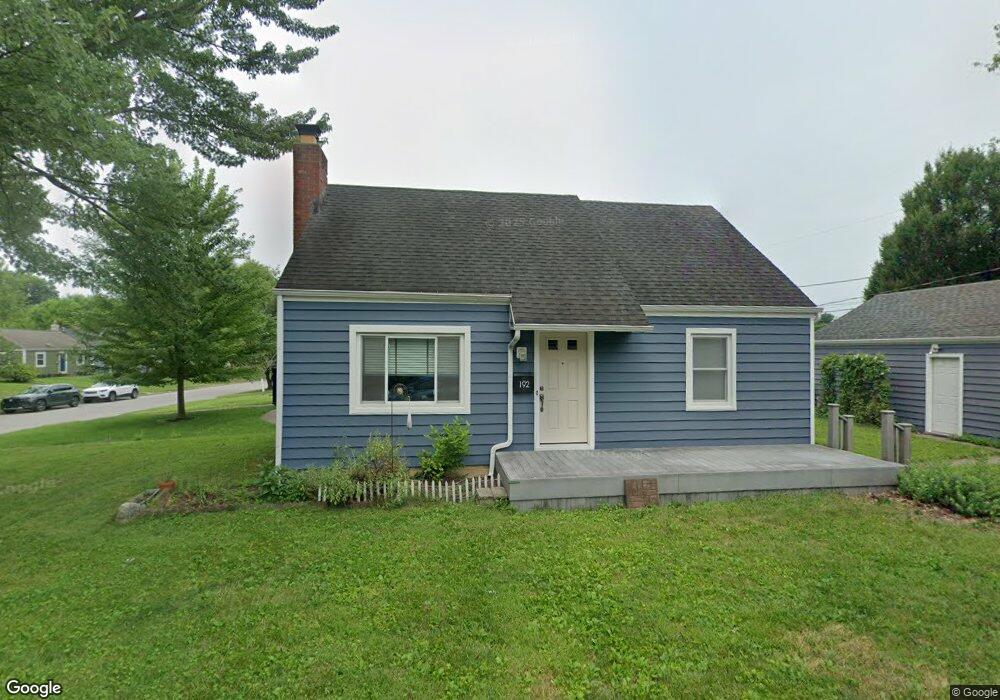
192 E Royal Forest Blvd Columbus, OH 43214
Clintonville NeighborhoodEstimated Value: $262,000 - $355,000
3
Beds
1
Bath
1,044
Sq Ft
$305/Sq Ft
Est. Value
About This Home
This home is located at 192 E Royal Forest Blvd, Columbus, OH 43214 and is currently estimated at $318,112, approximately $304 per square foot. 192 E Royal Forest Blvd is a home located in Franklin County with nearby schools including Indian Springs Elementary School, Dominion Middle School, and Whetstone High School.
Ownership History
Date
Name
Owned For
Owner Type
Purchase Details
Closed on
Oct 11, 2003
Sold by
Code Natasha C and Hebela Ashraf
Bought by
Thomas Vincent M and Mccrory Amy L
Current Estimated Value
Purchase Details
Closed on
May 5, 1999
Sold by
Lang Ronald M and Lang Diane S
Bought by
Code Natasha C
Home Financials for this Owner
Home Financials are based on the most recent Mortgage that was taken out on this home.
Original Mortgage
$90,200
Outstanding Balance
$23,306
Interest Rate
7.04%
Mortgage Type
FHA
Estimated Equity
$294,806
Purchase Details
Closed on
Dec 29, 1987
Bought by
Lang Ronald M
Purchase Details
Closed on
May 1, 1984
Create a Home Valuation Report for This Property
The Home Valuation Report is an in-depth analysis detailing your home's value as well as a comparison with similar homes in the area
Home Values in the Area
Average Home Value in this Area
Purchase History
| Date | Buyer | Sale Price | Title Company |
|---|---|---|---|
| Thomas Vincent M | $123,500 | -- | |
| Code Natasha C | $91,000 | Franklin Abstract | |
| Lang Ronald M | $65,000 | -- | |
| -- | $55,900 | -- |
Source: Public Records
Mortgage History
| Date | Status | Borrower | Loan Amount |
|---|---|---|---|
| Open | Code Natasha C | $90,200 |
Source: Public Records
Tax History Compared to Growth
Tax History
| Year | Tax Paid | Tax Assessment Tax Assessment Total Assessment is a certain percentage of the fair market value that is determined by local assessors to be the total taxable value of land and additions on the property. | Land | Improvement |
|---|---|---|---|---|
| 2024 | $3,935 | $87,680 | $36,160 | $51,520 |
| 2023 | $3,885 | $87,675 | $36,155 | $51,520 |
| 2022 | $3,516 | $67,800 | $21,910 | $45,890 |
| 2021 | $3,523 | $67,800 | $21,910 | $45,890 |
| 2020 | $3,527 | $67,800 | $21,910 | $45,890 |
| 2019 | $3,101 | $51,110 | $16,840 | $34,270 |
| 2018 | $2,900 | $51,110 | $16,840 | $34,270 |
| 2017 | $3,040 | $51,110 | $16,840 | $34,270 |
| 2016 | $2,982 | $45,010 | $14,070 | $30,940 |
| 2015 | $2,707 | $45,010 | $14,070 | $30,940 |
| 2014 | $2,713 | $45,010 | $14,070 | $30,940 |
| 2013 | $1,275 | $42,875 | $13,405 | $29,470 |
Source: Public Records
Map
Nearby Homes
- 247 E Jeffrey Place
- 134 E Jeffrey Place
- 343 E Jeffrey Place
- 381 E Jeffrey Place
- 420 E Beechwold Blvd
- 224 Morse Rd
- 4 W Royal Forest Blvd
- 255 Garden Rd
- 156 E Weisheimer Rd
- 93 Leland Ave
- 411 Garden Rd
- 116 Rathbone Ave
- 278 E Dominion Blvd
- 475 Garden Rd
- 601 Morse Rd
- 202 Rathbone Ave
- 26 E Schreyer Place
- 243 E Schreyer Place
- 646 E Beechwold Blvd
- 142 W Schreyer Place
- 182 E Royal Forest Blvd
- 204 E Royal Forest Blvd
- 176 E Royal Forest Blvd
- 210 E Royal Forest Blvd
- 191 E Jeffrey Place
- 187 E Jeffrey Place
- 172 E Royal Forest Blvd
- 181 E Jeffrey Place
- 203 E Jeffrey Place
- 191 E Royal Forest Blvd
- 175 E Jeffrey Place
- 187 E Royal Forest Blvd
- 209 E Jeffrey Place
- 181 E Royal Forest Blvd
- 220 E Royal Forest Blvd
- 166 E Royal Forest Blvd
- 203 E Royal Forest Blvd
- 177 E Royal Forest Blvd
- 215 E Jeffrey Place
- 209 E Royal Forest Blvd