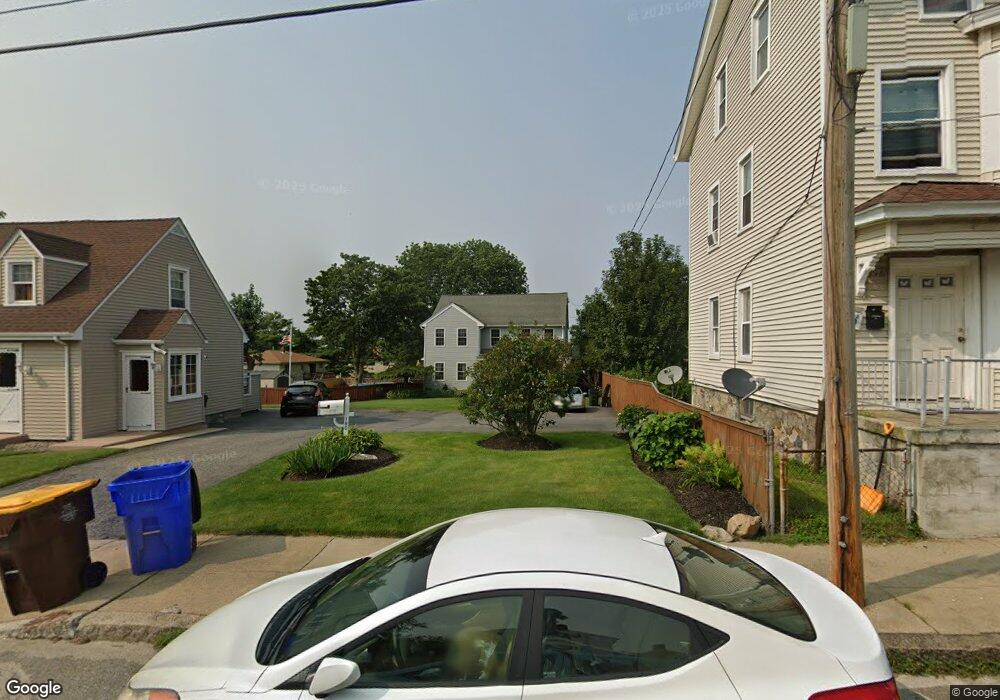
192 Globe St Fall River, MA 02724
Sandy Beach NeighborhoodEstimated Value: $475,216 - $514,000
3
Beds
3
Baths
1,984
Sq Ft
$253/Sq Ft
Est. Value
About This Home
This home is located at 192 Globe St, Fall River, MA 02724 and is currently estimated at $502,054, approximately $253 per square foot. 192 Globe St is a home located in Bristol County with nearby schools including Carlton M. Viveiros Elementary School, Matthew J. Kuss Middle School, and B M C Durfee High School.
Ownership History
Date
Name
Owned For
Owner Type
Purchase Details
Closed on
Jun 9, 2004
Sold by
Boule Raymond and Boule Sandra A
Bought by
Boule Aida R and Boule Joseph B
Current Estimated Value
Home Financials for this Owner
Home Financials are based on the most recent Mortgage that was taken out on this home.
Original Mortgage
$190,000
Outstanding Balance
$92,817
Interest Rate
5.99%
Mortgage Type
Purchase Money Mortgage
Estimated Equity
$409,237
Create a Home Valuation Report for This Property
The Home Valuation Report is an in-depth analysis detailing your home's value as well as a comparison with similar homes in the area
Home Values in the Area
Average Home Value in this Area
Purchase History
| Date | Buyer | Sale Price | Title Company |
|---|---|---|---|
| Boule Aida R | -- | -- |
Source: Public Records
Mortgage History
| Date | Status | Borrower | Loan Amount |
|---|---|---|---|
| Open | Boule Aida R | $190,000 |
Source: Public Records
Tax History
| Year | Tax Paid | Tax Assessment Tax Assessment Total Assessment is a certain percentage of the fair market value that is determined by local assessors to be the total taxable value of land and additions on the property. | Land | Improvement |
|---|---|---|---|---|
| 2025 | $4,428 | $386,700 | $112,500 | $274,200 |
| 2024 | $4,141 | $360,400 | $108,300 | $252,100 |
| 2023 | $4,131 | $336,700 | $89,500 | $247,200 |
| 2022 | $3,661 | $290,100 | $85,200 | $204,900 |
| 2021 | $3,552 | $256,800 | $81,100 | $175,700 |
| 2020 | $3,530 | $244,300 | $79,900 | $164,400 |
| 2019 | $3,422 | $234,700 | $77,000 | $157,700 |
| 2018 | $3,379 | $231,100 | $83,300 | $147,800 |
| 2017 | $3,143 | $224,500 | $79,400 | $145,100 |
| 2016 | $3,008 | $220,700 | $84,500 | $136,200 |
| 2015 | $3,028 | $231,500 | $84,500 | $147,000 |
| 2014 | $2,881 | $229,000 | $82,000 | $147,000 |
Source: Public Records
Map
Nearby Homes
- 20 Wilcox St
- 464 Birch St
- 245 Dwelly St
- 1334 S Main St
- 1273-1279 S Main St
- 609 King Philip St
- 70 Brown St
- 1846 S Main St
- 1852 S Main St
- 234 Kilburn St
- 917 Dwelly St
- 344-354 E Main St
- 57 Larouche St
- 15 Higgins St
- 71 Mystic St Unit 3
- 219 Montaup St
- 82 Montaup St
- 240 Montaup St
- 700 Shore Dr Unit 6-604
- 700 Shore Dr Unit 1205
Your Personal Tour Guide
Ask me questions while you tour the home.