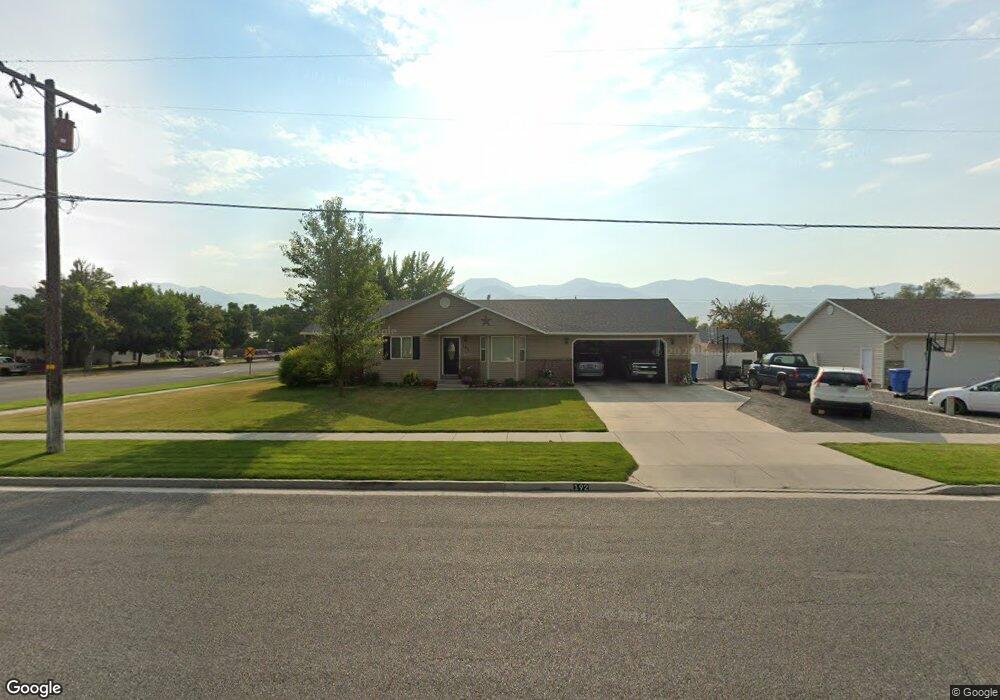
192 N 400 W Smithfield, UT 84335
Estimated Value: $472,000 - $509,000
4
Beds
2
Baths
2,920
Sq Ft
$167/Sq Ft
Est. Value
About This Home
This home is located at 192 N 400 W, Smithfield, UT 84335 and is currently estimated at $486,320, approximately $166 per square foot. 192 N 400 W is a home located in Cache County with nearby schools including Birch Creek School, North Cache Middle School, and White Pine Middle School.
Ownership History
Date
Name
Owned For
Owner Type
Purchase Details
Closed on
Jan 28, 2010
Sold by
Killam William S and Killam Melinda L
Bought by
Hillyard Devin John and Hillyard Candace Miller
Current Estimated Value
Home Financials for this Owner
Home Financials are based on the most recent Mortgage that was taken out on this home.
Original Mortgage
$195,447
Outstanding Balance
$138,840
Interest Rate
4.91%
Mortgage Type
Purchase Money Mortgage
Estimated Equity
$347,480
Purchase Details
Closed on
Mar 3, 2005
Sold by
Lillywhite David
Bought by
Killam William S and Killam Melinda L
Home Financials for this Owner
Home Financials are based on the most recent Mortgage that was taken out on this home.
Original Mortgage
$146,432
Interest Rate
5.66%
Mortgage Type
VA
Create a Home Valuation Report for This Property
The Home Valuation Report is an in-depth analysis detailing your home's value as well as a comparison with similar homes in the area
Home Values in the Area
Average Home Value in this Area
Purchase History
| Date | Buyer | Sale Price | Title Company |
|---|---|---|---|
| Hillyard Devin John | -- | Cache Title Company | |
| Killam William S | -- | Cache Title Company |
Source: Public Records
Mortgage History
| Date | Status | Borrower | Loan Amount |
|---|---|---|---|
| Open | Hillyard Devin John | $195,447 | |
| Previous Owner | Killam William S | $146,432 |
Source: Public Records
Tax History
| Year | Tax Paid | Tax Assessment Tax Assessment Total Assessment is a certain percentage of the fair market value that is determined by local assessors to be the total taxable value of land and additions on the property. | Land | Improvement |
|---|---|---|---|---|
| 2025 | $1,935 | $259,080 | $0 | $0 |
| 2024 | $1,828 | $229,505 | $0 | $0 |
| 2023 | $1,911 | $226,980 | $0 | $0 |
| 2022 | $1,942 | $226,980 | $0 | $0 |
| 2021 | $1,928 | $344,155 | $70,000 | $274,155 |
| 2020 | $1,689 | $281,255 | $70,000 | $211,255 |
| 2019 | $1,614 | $256,255 | $45,000 | $211,255 |
| 2018 | $1,490 | $228,700 | $45,000 | $183,700 |
| 2017 | $1,390 | $116,600 | $0 | $0 |
| 2016 | $1,415 | $116,600 | $0 | $0 |
| 2015 | $1,283 | $105,320 | $0 | $0 |
| 2014 | $1,258 | $105,320 | $0 | $0 |
| 2013 | -- | $105,320 | $0 | $0 |
Source: Public Records
Map
Nearby Homes
Your Personal Tour Guide
Ask me questions while you tour the home.