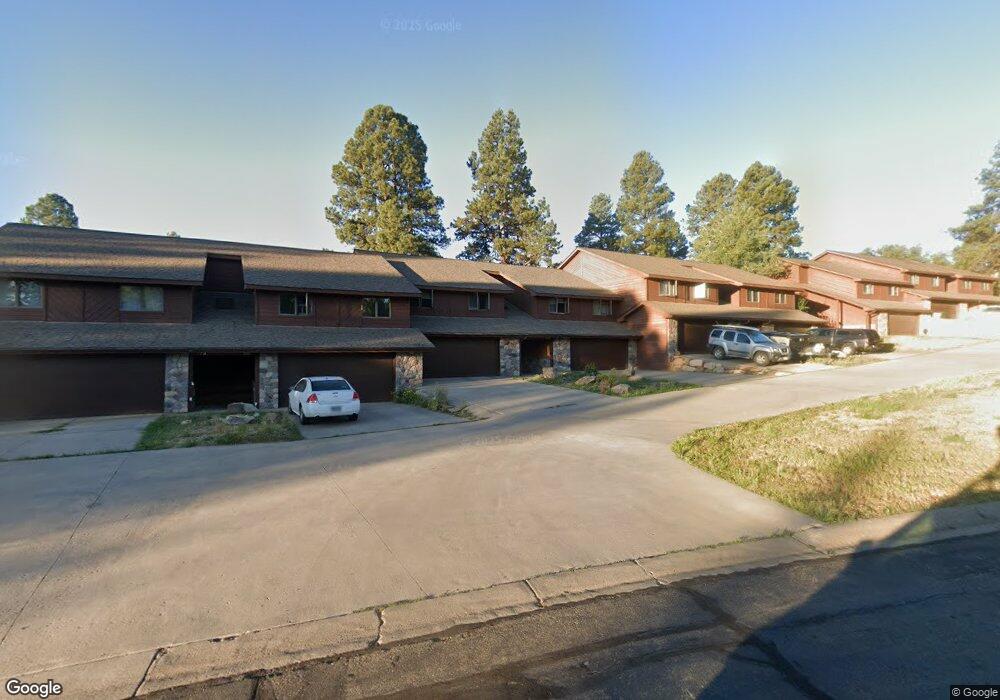
192 Pine Ridge Loop Unit B3 Durango, CO 81301
Durango West NeighborhoodEstimated Value: $542,000 - $629,000
3
Beds
2
Baths
1,800
Sq Ft
$323/Sq Ft
Est. Value
About This Home
This home is located at 192 Pine Ridge Loop Unit B3, Durango, CO 81301 and is currently estimated at $582,063, approximately $323 per square foot. 192 Pine Ridge Loop Unit B3 is a home located in La Plata County with nearby schools including Park Elementary School, Escalante Middle School, and Durango High School.
Ownership History
Date
Name
Owned For
Owner Type
Purchase Details
Closed on
May 29, 2013
Sold by
Kolb Jane E and Goessel Jane
Bought by
Fuller Alan R and Fuller Theresa A
Current Estimated Value
Home Financials for this Owner
Home Financials are based on the most recent Mortgage that was taken out on this home.
Original Mortgage
$122,000
Outstanding Balance
$86,551
Interest Rate
3.43%
Mortgage Type
New Conventional
Estimated Equity
$495,512
Purchase Details
Closed on
Feb 24, 2009
Sold by
Tyner Stone Tammy Lee
Bought by
Kolb Jane E
Home Financials for this Owner
Home Financials are based on the most recent Mortgage that was taken out on this home.
Original Mortgage
$198,750
Interest Rate
5.06%
Mortgage Type
New Conventional
Purchase Details
Closed on
Feb 4, 2000
Bought by
Fuller Alan R and Fuller Theresa A
Create a Home Valuation Report for This Property
The Home Valuation Report is an in-depth analysis detailing your home's value as well as a comparison with similar homes in the area
Home Values in the Area
Average Home Value in this Area
Purchase History
| Date | Buyer | Sale Price | Title Company |
|---|---|---|---|
| Fuller Alan R | $247,000 | Land Title | |
| Kolb Jane E | $265,000 | Land Title Guarantee Company | |
| Fuller Alan R | $128,500 | -- |
Source: Public Records
Mortgage History
| Date | Status | Borrower | Loan Amount |
|---|---|---|---|
| Open | Fuller Alan R | $122,000 | |
| Previous Owner | Kolb Jane E | $198,750 |
Source: Public Records
Tax History
| Year | Tax Paid | Tax Assessment Tax Assessment Total Assessment is a certain percentage of the fair market value that is determined by local assessors to be the total taxable value of land and additions on the property. | Land | Improvement |
|---|---|---|---|---|
| 2025 | $1,192 | $35,260 | -- | $35,260 |
| 2024 | $1,020 | $24,300 | -- | $24,300 |
| 2023 | $1,020 | $27,240 | $0 | $27,240 |
| 2022 | $991 | $29,030 | $0 | $29,030 |
| 2021 | $996 | $24,010 | $0 | $24,010 |
| 2020 | $896 | $22,270 | $0 | $22,270 |
| 2019 | $859 | $22,270 | $0 | $22,270 |
| 2018 | $841 | $21,830 | $0 | $21,830 |
| 2017 | $823 | $21,830 | $0 | $21,830 |
| 2016 | $717 | $20,600 | $0 | $20,600 |
| 2015 | $296 | $20,600 | $0 | $20,600 |
| 2014 | $296 | $17,390 | $0 | $17,390 |
| 2013 | -- | $17,390 | $0 | $17,390 |
Source: Public Records
Map
Nearby Homes
- 209 Fir Dr
- 23 Hunter Ct
- 841 Oak Dr
- 678 N Lakeside Dr
- 178 Oak Dr
- 40 Hidden Ln
- 199 Timber Dr
- 178 Canyon Creek Trail
- 173 Canyon Creek Trail
- 719 Terlun Dr
- TBD Vaquero Way
- 351 Cherry Gulch Rd
- 269 North Rd
- 307 Deer Trail Rd
- 717 Zane Dr
- 51 Shenandoah Cir
- 17235 Hwy 160
- 111 Rendezvous Trail
- 1172 Ridge Rd
- 275 Logging Trail Rd
- 192 Pine Ridge Loop Unit B-3
- 192 Pine Ridge Loop Unit B-3
- 0 Pine Ridge Loop B-3 Unit B-3 645460
- 198 Pine Ridge Loop Unit B2
- 222 Pine Ridge Loop Unit A4
- 0 Pine Ridge Loop A4
- 216 Pine Ridge Loop Unit A5
- 202 Pine Ridge Loop Unit B1
- 202 Pine Ridge Loop Unit B1
- 226 Pine Ridge Loop Unit A3
- 212 Pine Ridge Loop Unit A6
- 232 Pine Ridge Loop Unit A2
- 238 Pine Ridge Loop Unit A1
- 178 Pine Ridge Loop
- 11752 Highway 160
- 213 Pine Ridge Loop
- 189 Pine Ridge Loop
- 169 Pine Ridge Loop
- 160 Pine Ridge Loop
- 400 Fir Dr
Your Personal Tour Guide
Ask me questions while you tour the home.