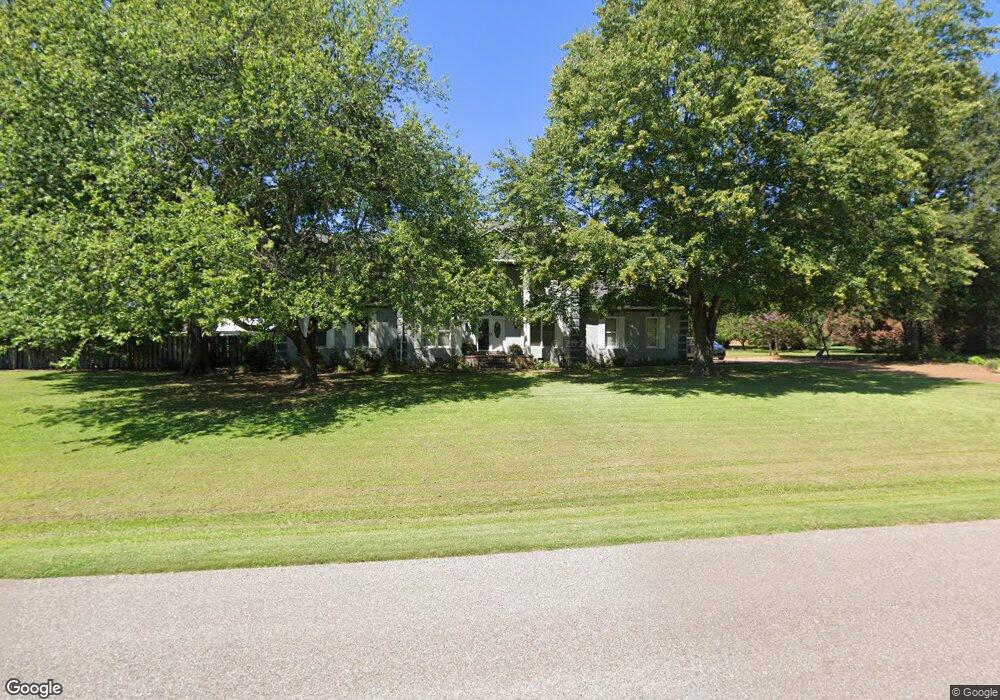
192 Redfield Dr Jackson, TN 38305
Estimated Value: $487,000 - $577,000
Studio
4
Baths
4,286
Sq Ft
$123/Sq Ft
Est. Value
About This Home
This home is located at 192 Redfield Dr, Jackson, TN 38305 and is currently estimated at $528,091, approximately $123 per square foot. 192 Redfield Dr is a home located in Madison County with nearby schools including Pope School, Northeast Middle School, and North Side High School.
Ownership History
Date
Name
Owned For
Owner Type
Purchase Details
Closed on
Oct 3, 2008
Sold by
Smith William L
Bought by
Buback Michael
Current Estimated Value
Purchase Details
Closed on
Jan 2, 2003
Sold by
Geissinger John B
Bought by
Smith William L
Home Financials for this Owner
Home Financials are based on the most recent Mortgage that was taken out on this home.
Original Mortgage
$44,000
Interest Rate
5.25%
Purchase Details
Closed on
Aug 2, 1996
Sold by
Marnell Gerald E
Bought by
John Geissinger
Home Financials for this Owner
Home Financials are based on the most recent Mortgage that was taken out on this home.
Original Mortgage
$220,500
Interest Rate
7.63%
Purchase Details
Closed on
Jun 22, 1990
Bought by
Marnell Gerald E
Purchase Details
Closed on
Nov 15, 1989
Bought by
Walker Windal A
Purchase Details
Closed on
Aug 28, 1989
Bought by
Cherry Hill Pl
Purchase Details
Closed on
Dec 29, 1986
Bought by
Johnson Ralph A and Lee Bradley
Create a Home Valuation Report for This Property
The Home Valuation Report is an in-depth analysis detailing your home's value as well as a comparison with similar homes in the area
Purchase History
| Date | Buyer | Sale Price | Title Company |
|---|---|---|---|
| Buback Michael | $275,000 | -- | |
| Smith William L | $260,000 | -- | |
| John Geissinger | $245,000 | -- | |
| Marnell Gerald E | $190,000 | -- | |
| Walker Windal A | -- | -- | |
| Cherry Hill Pl | -- | -- | |
| Johnson Ralph A | -- | -- |
Source: Public Records
Mortgage History
| Date | Status | Borrower | Loan Amount |
|---|---|---|---|
| Previous Owner | Johnson Ralph A | $44,000 | |
| Previous Owner | Johnson Ralph A | $220,500 |
Source: Public Records
Tax History
| Year | Tax Paid | Tax Assessment Tax Assessment Total Assessment is a certain percentage of the fair market value that is determined by local assessors to be the total taxable value of land and additions on the property. | Land | Improvement |
|---|---|---|---|---|
| 2025 | $2,080 | $111,000 | $15,000 | $96,000 |
| 2024 | $2,080 | $111,000 | $15,000 | $96,000 |
| 2022 | $3,718 | $106,675 | $15,000 | $91,675 |
| 2021 | $3,022 | $70,100 | $6,825 | $63,275 |
| 2020 | $3,022 | $70,100 | $6,825 | $63,275 |
| 2019 | $2,984 | $70,100 | $6,825 | $63,275 |
| 2018 | $2,984 | $69,200 | $6,825 | $62,375 |
| 2017 | $2,910 | $65,950 | $6,825 | $59,125 |
| 2016 | $2,712 | $65,950 | $6,825 | $59,125 |
| 2015 | $2,712 | $65,950 | $6,825 | $59,125 |
| 2014 | $2,712 | $65,950 | $6,825 | $59,125 |
Source: Public Records
Map
Nearby Homes
- 465 Shadow Ridge Dr
- 35 Hampstead Cove
- 100 Crest Ridge Dr
- 54 Laurelwood Cove
- 119 Stonehenge Dr
- 9 Citrus Springs Cove
- 60 Greendale Dr
- 64 Swanbourne Cove
- 58 Swanbourne Cove
- 52 Buckingham Cove
- 33 Summerfield Dr
- 114 Larkwood Dr
- 116 Ravenwood Dr
- 127 Larkwood Dr
- 42 Wilmington Cove
- 107 Wyndchase Dr
- 812 Pipkin Rd
- 24 Stornaway Dr
- 159 Larkwood Dr
- 52 Kinnewick Cove
- 23 Maplemere Cove
- 174 Redfield Dr
- 212 Redfield Dr
- 195 Redfield Dr
- 40 Hickory Glen Dr
- 183 Redfield Dr
- 35 Maplemere Cove
- 207 Redfield Dr
- 26 Maplemere Cove
- 30 Hickory Glen Dr
- 171 Redfield Dr
- 219 Redfield Dr
- 242 Redfield Dr
- 45 Maplemere Cove
- 42 Maplemere Cove
- 22 Hickory Glen Dr
- 231 Redfield Dr
- 152 Redfield Dr
- 41 Hickory Glen Dr
- 159 Redfield Dr
Your Personal Tour Guide
Ask me questions while you tour the home.