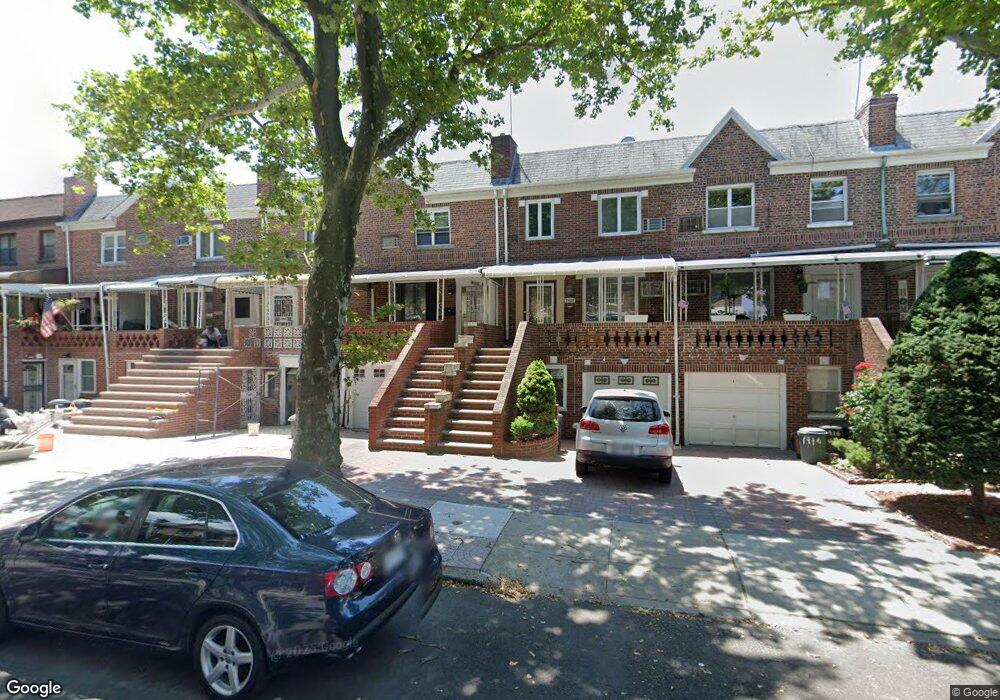
1920 19th Ln Brooklyn, NY 11214
Bath Beach NeighborhoodEstimated Value: $1,081,829 - $1,154,000
3
Beds
2
Baths
1,584
Sq Ft
$699/Sq Ft
Est. Value
About This Home
This home is located at 1920 19th Ln, Brooklyn, NY 11214 and is currently estimated at $1,106,457, approximately $698 per square foot. 1920 19th Ln is a home located in Kings County with nearby schools including Is 281 Joseph B Cavallaro, Bais Yaakov of Bay Parkway, and Sinai Academic Center.
Ownership History
Date
Name
Owned For
Owner Type
Purchase Details
Closed on
Sep 28, 2016
Sold by
Bhpt Llc
Bought by
Truong Luong D
Current Estimated Value
Home Financials for this Owner
Home Financials are based on the most recent Mortgage that was taken out on this home.
Original Mortgage
$534,000
Outstanding Balance
$427,693
Interest Rate
3.43%
Mortgage Type
New Conventional
Estimated Equity
$678,764
Purchase Details
Closed on
Sep 21, 2015
Sold by
Ginem Nabil
Bought by
Bhpt Llc
Purchase Details
Closed on
Nov 15, 2007
Sold by
Mark William Lai Kun
Bought by
Ginem Nabil
Home Financials for this Owner
Home Financials are based on the most recent Mortgage that was taken out on this home.
Original Mortgage
$526,500
Interest Rate
6.48%
Mortgage Type
Purchase Money Mortgage
Purchase Details
Closed on
Sep 18, 2003
Sold by
Lee Oun Yon and Lee Mark William
Bought by
Mark William Lai Kun
Create a Home Valuation Report for This Property
The Home Valuation Report is an in-depth analysis detailing your home's value as well as a comparison with similar homes in the area
Home Values in the Area
Average Home Value in this Area
Purchase History
| Date | Buyer | Sale Price | Title Company |
|---|---|---|---|
| Truong Luong D | $780,000 | -- | |
| Truong Luong D | $780,000 | -- | |
| Bhpt Llc | $500,000 | -- | |
| Bhpt Llc | $500,000 | -- | |
| Ginem Nabil | $585,000 | -- | |
| Ginem Nabil | $585,000 | -- | |
| Mark William Lai Kun | -- | -- | |
| Mark William Lai Kun | -- | -- |
Source: Public Records
Mortgage History
| Date | Status | Borrower | Loan Amount |
|---|---|---|---|
| Open | Truong Luong D | $534,000 | |
| Closed | Truong Luong D | $534,000 | |
| Previous Owner | Ginem Nabil | $526,500 |
Source: Public Records
Tax History Compared to Growth
Tax History
| Year | Tax Paid | Tax Assessment Tax Assessment Total Assessment is a certain percentage of the fair market value that is determined by local assessors to be the total taxable value of land and additions on the property. | Land | Improvement |
|---|---|---|---|---|
| 2025 | $7,340 | $67,140 | $9,540 | $57,600 |
| 2024 | $7,340 | $53,040 | $9,540 | $43,500 |
| 2023 | $7,366 | $60,540 | $9,540 | $51,000 |
| 2022 | $6,831 | $56,040 | $9,540 | $46,500 |
| 2021 | $6,794 | $53,100 | $9,540 | $43,560 |
| 2020 | $3,186 | $58,440 | $9,540 | $48,900 |
| 2019 | $6,371 | $58,440 | $9,540 | $48,900 |
| 2018 | $6,162 | $30,226 | $5,038 | $25,188 |
| 2017 | $5,813 | $28,516 | $6,228 | $22,288 |
| 2016 | $5,378 | $26,902 | $7,491 | $19,411 |
| 2015 | $3,852 | $25,380 | $10,620 | $14,760 |
| 2014 | $3,852 | $25,380 | $10,620 | $14,760 |
Source: Public Records
Map
Nearby Homes
- 1383 Shore Pkwy
- 263 Bay 22nd St
- 306 Bay 20th St
- 1333 Shore Pkwy Unit A
- 289 Bay 19th St Unit B
- 271 Bay 19th St Unit B
- 263 Bay 19th St Unit B
- 1941 Cropsey Ave
- 248 Bay 19th St Unit B
- 304 Bay 17th St Unit 3A
- 1830 Bath Ave Unit A102
- 8889 Bay 16th St Unit 1C
- 8867 Bay 16th St Unit B3
- 187 Bay 26th St
- 8880 Bay 16th St
- 143 Bay 20th St Unit 5
- 8759 18th Ave Unit 4
- 2115 Cropsey Ave
- 142 Bay 25th St
- 127 Bay 23rd St