1920 Arbor Glen Unit 21 Escondido, CA 92025
Kit Carson NeighborhoodEstimated Value: $616,102 - $744,000
3
Beds
3
Baths
1,460
Sq Ft
$464/Sq Ft
Est. Value
About This Home
This home is located at 1920 Arbor Glen Unit 21, Escondido, CA 92025 and is currently estimated at $677,276, approximately $463 per square foot. 1920 Arbor Glen Unit 21 is a home located in San Diego County with nearby schools including L. R. Green Elementary School, Bear Valley Middle School, and San Pasqual High School.
Ownership History
Date
Name
Owned For
Owner Type
Purchase Details
Closed on
Aug 5, 2020
Sold by
Kambestad Devin and Kambestad Michelle
Bought by
Mckown Devin and Kambestad Michelle Dione
Current Estimated Value
Purchase Details
Closed on
Oct 22, 2013
Sold by
Bentley Daniel and Bentley Jill M
Bought by
Kambestad Devin and Kambestad Michelle
Home Financials for this Owner
Home Financials are based on the most recent Mortgage that was taken out on this home.
Original Mortgage
$245,000
Outstanding Balance
$181,712
Interest Rate
4.17%
Mortgage Type
New Conventional
Estimated Equity
$495,564
Purchase Details
Closed on
Nov 10, 2003
Sold by
Hallmarks Arbor Villas Llc
Bought by
Bentley Daniel and Bentley Jill M
Home Financials for this Owner
Home Financials are based on the most recent Mortgage that was taken out on this home.
Original Mortgage
$269,000
Interest Rate
5.92%
Mortgage Type
Stand Alone First
Create a Home Valuation Report for This Property
The Home Valuation Report is an in-depth analysis detailing your home's value as well as a comparison with similar homes in the area
Home Values in the Area
Average Home Value in this Area
Purchase History
| Date | Buyer | Sale Price | Title Company |
|---|---|---|---|
| Mckown Devin | -- | None Available | |
| Kambestad Devin | $354,000 | Lawyers Title | |
| Bentley Daniel | $345,500 | Chicago Title Co |
Source: Public Records
Mortgage History
| Date | Status | Borrower | Loan Amount |
|---|---|---|---|
| Open | Kambestad Devin | $245,000 | |
| Previous Owner | Bentley Daniel | $269,000 |
Source: Public Records
Tax History Compared to Growth
Tax History
| Year | Tax Paid | Tax Assessment Tax Assessment Total Assessment is a certain percentage of the fair market value that is determined by local assessors to be the total taxable value of land and additions on the property. | Land | Improvement |
|---|---|---|---|---|
| 2025 | $4,799 | $433,943 | $245,166 | $188,777 |
| 2024 | $4,799 | $425,435 | $240,359 | $185,076 |
| 2023 | $4,689 | $417,095 | $235,647 | $181,448 |
| 2022 | $4,638 | $408,918 | $231,027 | $177,891 |
| 2021 | $4,561 | $400,901 | $226,498 | $174,403 |
| 2020 | $4,534 | $396,791 | $224,176 | $172,615 |
| 2019 | $4,423 | $389,012 | $219,781 | $169,231 |
| 2018 | $4,300 | $381,385 | $215,472 | $165,913 |
| 2017 | $42 | $373,908 | $211,248 | $162,660 |
| 2016 | $4,147 | $366,577 | $207,106 | $159,471 |
| 2015 | $4,111 | $361,072 | $203,996 | $157,076 |
| 2014 | $3,939 | $354,000 | $200,000 | $154,000 |
Source: Public Records
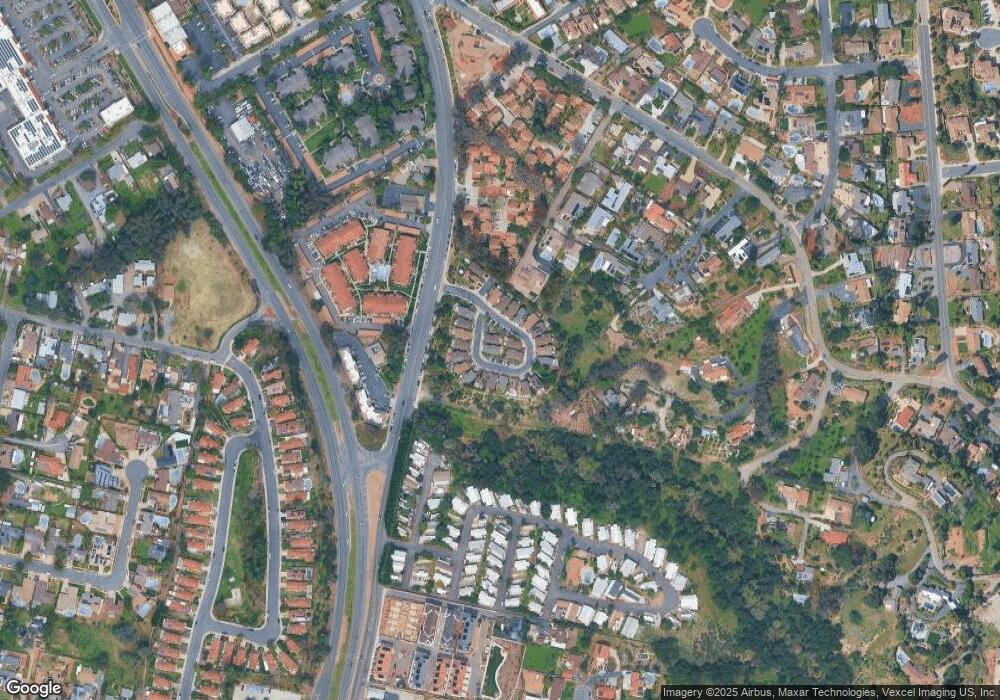
Map
Nearby Homes
- 450 W Vermont Ave Unit 1602
- 450 W Vermont Ave Unit 807
- 450 W Vermont Ave
- 2217 Brix Glen
- 1860 S Escondido Blvd
- 303 Amparo Dr
- 2328 Columba Glen
- 2339 Red Coral Glen
- 2341 Red Coral Glen
- 2342 Red Coral Glen
- 2343 Red Coral Glen
- Residence 3A Plan at Tesoro Square
- Residence 2B Plan at Tesoro Square
- Residence 1B Plan at Tesoro Square
- 1365 Amanda Glen S
- 440 W Citracado Pkwy Unit 16
- 2011 Rachelle Place
- 1958 Lejos Dr
- 427 Carina Glen
- 1651 S Juniper St Unit 137
- 1918 Arbor Glen Unit 22
- 1922 Arbor Glen Unit 20
- 2015 Arbor Glen
- 1928 Arbor Glen Unit 19
- 1932 Arbor Glen Unit 18
- 1910 Arbor Glen
- 1994 Arbor Glen Unit 4
- 181 Sunwest Glen
- 0000 Arbor Glen
- 1990 Arbor Glen Unit 5
- 1998 Arbor Glen
- 1914 Arbor Glen
- 1939 Arbor Glen
- 1933 Arbor Glen
- 1985 Arbor Glen
- 1993 Arbor Glen
- 1902 Arbor Glen
- 1904 Arbor Glen
- 1986 Arbor Glen Unit 6
- 1980 Arbor Glen Unit 7