1920 N Seminary Ave Unit D Chicago, IL 60614
Old Town NeighborhoodEstimated Value: $422,413 - $624,000
2
Beds
1
Bath
11,975
Sq Ft
$41/Sq Ft
Est. Value
About This Home
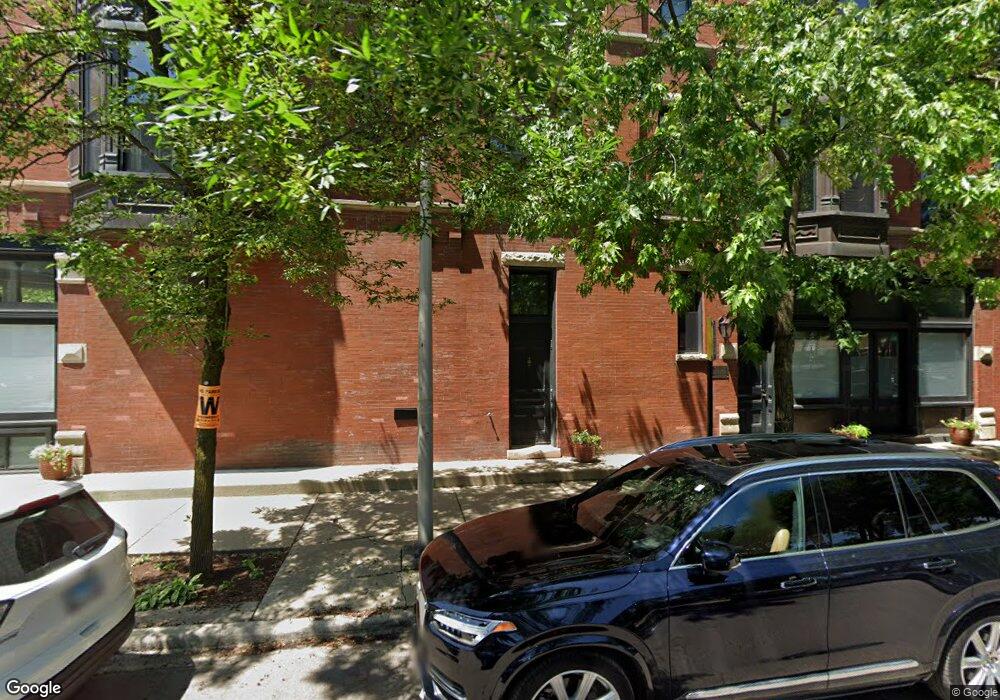
This home is located at 1920 N Seminary Ave Unit D, Chicago, IL 60614 and is currently estimated at $490,603, approximately $40 per square foot. 1920 N Seminary Ave Unit D is a home located in Cook County with nearby schools including Mayer Elementary School, Lincoln Park High School, and St. James Lutheran School.
Ownership History
Date
Name
Owned For
Owner Type
Purchase Details
Closed on
Nov 28, 2023
Sold by
Clint J Mosling Trust
Bought by
Adkins Jasmine
Current Estimated Value
Home Financials for this Owner
Home Financials are based on the most recent Mortgage that was taken out on this home.
Original Mortgage
$270,000
Outstanding Balance
$265,467
Interest Rate
7.44%
Mortgage Type
Construction
Estimated Equity
$225,136
Purchase Details
Closed on
Mar 17, 2014
Sold by
Mosling Clint J
Bought by
Mosling Clint J and Clint J Mosling Trust
Purchase Details
Closed on
Sep 3, 2004
Sold by
Miller Robert F
Bought by
Mosling Clint
Purchase Details
Closed on
Apr 25, 1997
Sold by
Hunt Russell S
Bought by
Miller Robert F
Home Financials for this Owner
Home Financials are based on the most recent Mortgage that was taken out on this home.
Original Mortgage
$164,000
Interest Rate
7.87%
Create a Home Valuation Report for This Property
The Home Valuation Report is an in-depth analysis detailing your home's value as well as a comparison with similar homes in the area
Home Values in the Area
Average Home Value in this Area
Purchase History
| Date | Buyer | Sale Price | Title Company |
|---|---|---|---|
| Adkins Jasmine | $360,000 | Fidelity National Title | |
| Mosling Clint J | -- | None Available | |
| Mosling Clint | $380,000 | Baird & Warner Title Service | |
| Miller Robert F | $214,000 | -- |
Source: Public Records
Mortgage History
| Date | Status | Borrower | Loan Amount |
|---|---|---|---|
| Open | Adkins Jasmine | $270,000 | |
| Previous Owner | Miller Robert F | $164,000 |
Source: Public Records
Tax History Compared to Growth
Tax History
| Year | Tax Paid | Tax Assessment Tax Assessment Total Assessment is a certain percentage of the fair market value that is determined by local assessors to be the total taxable value of land and additions on the property. | Land | Improvement |
|---|---|---|---|---|
| 2024 | $4,280 | $39,895 | $5,063 | $34,832 |
| 2023 | $4,150 | $23,600 | $4,083 | $19,517 |
| 2022 | $4,150 | $23,600 | $4,083 | $19,517 |
| 2021 | $4,076 | $23,599 | $4,083 | $19,516 |
| 2020 | $7,331 | $36,013 | $3,593 | $32,420 |
| 2019 | $7,169 | $39,113 | $3,593 | $35,520 |
| 2018 | $7,048 | $39,113 | $3,593 | $35,520 |
| 2017 | $6,628 | $34,163 | $2,939 | $31,224 |
| 2016 | $6,342 | $34,163 | $2,939 | $31,224 |
| 2015 | $5,780 | $34,163 | $2,939 | $31,224 |
| 2014 | $5,799 | $33,821 | $2,204 | $31,617 |
| 2013 | $5,673 | $33,821 | $2,204 | $31,617 |
Source: Public Records
Map
Nearby Homes
- 2014 N Seminary Ave Unit 2
- 1872 N Clybourn Ave Unit 603
- 2026 N Kenmore Ave
- 1928 N Bissell St
- 1962 N Bissell St
- 2103 N Clifton Ave
- 2106 N Seminary Ave Unit 3
- 2051 N Magnolia Ave
- 1808 N Bissell St Unit 3A
- 2100 N Racine Ave Unit 4B
- 2118 N Sheffield Ave Unit 2
- 2118 N Sheffield Ave Unit 1
- 1823 N Bissell St
- 2127 N Racine Ave Unit 2
- 1822 N Fremont St
- 1242 W Dickens Ave
- 1837 N Fremont St
- 2146 N Racine Ave Unit 1
- 1927 N Dayton St
- 1848 N Dayton St
- 1920 N Seminary Ave Unit 1F
- 1920 N Seminary Ave Unit 1R
- 1920 N Seminary Ave Unit C
- 1920 N Seminary Ave Unit A
- 1920 N Seminary Ave Unit E
- 1920 N Seminary Ave Unit B
- 1924 N Seminary Ave Unit CH
- 1925 N Maud Ave Unit IV
- 1925 N Maud Ave Unit V
- 1925 N Maud Ave Unit II
- 1925 N Maud Ave Unit III
- 1925 N Maud Ave Unit I
- 1925 N Maud Ave Unit G1
- 1925 N Maud Ave Unit 3
- 1925 N Maud Ave Unit 2
- 1925 N Maud Ave Unit 4
- 1927 N Maud Ave
- 1916 N Maud Ave Unit 1916C
- 1916 N Maud Ave Unit C
- 1931 N Maud Ave