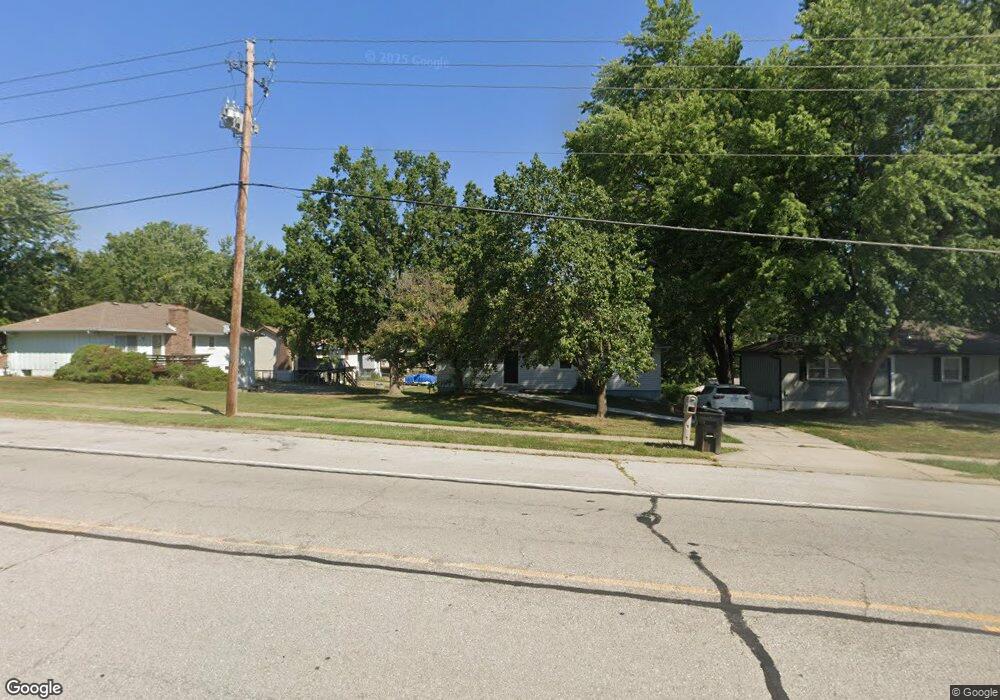
19204 E R D Mize Rd Independence, MO 64057
Blackburn NeighborhoodEstimated Value: $232,000 - $264,000
3
Beds
3
Baths
1,666
Sq Ft
$150/Sq Ft
Est. Value
About This Home
This home is located at 19204 E R D Mize Rd, Independence, MO 64057 and is currently estimated at $250,254, approximately $150 per square foot. 19204 E R D Mize Rd is a home located in Jackson County with nearby schools including LITTLE BLUE ELEM., Bridger Middle School, and Pioneer Ridge Middle School.
Ownership History
Date
Name
Owned For
Owner Type
Purchase Details
Closed on
Mar 18, 2022
Sold by
Jcg Community Properties Llc
Bought by
Ys Avon Sfr Iii Propco Llc
Current Estimated Value
Purchase Details
Closed on
Jun 29, 2017
Sold by
Watson David G
Bought by
Jcg Community Properties Llc
Purchase Details
Closed on
Feb 23, 2009
Sold by
Dowell Virgil L and Dowell Helen M
Bought by
Watson David G
Home Financials for this Owner
Home Financials are based on the most recent Mortgage that was taken out on this home.
Original Mortgage
$109,971
Interest Rate
4.92%
Mortgage Type
FHA
Purchase Details
Closed on
Mar 3, 2005
Sold by
Homestead Mortgage
Bought by
Dowell Virgil L and Dowell Helen M
Home Financials for this Owner
Home Financials are based on the most recent Mortgage that was taken out on this home.
Original Mortgage
$109,250
Interest Rate
5.62%
Mortgage Type
Purchase Money Mortgage
Purchase Details
Closed on
Jul 1, 2004
Sold by
Barnes Jerry C and Barnes Jerry Carl
Bought by
Homestead Mortgage
Create a Home Valuation Report for This Property
The Home Valuation Report is an in-depth analysis detailing your home's value as well as a comparison with similar homes in the area
Home Values in the Area
Average Home Value in this Area
Purchase History
| Date | Buyer | Sale Price | Title Company |
|---|---|---|---|
| Ys Avon Sfr Iii Propco Llc | -- | Bc Law Firm Pa | |
| Jcg Community Properties Llc | $99,841 | Stewart Title | |
| Watson David G | -- | Chicago | |
| Dowell Virgil L | -- | Great Plains Title Company | |
| Homestead Mortgage | -- | Ctic |
Source: Public Records
Mortgage History
| Date | Status | Borrower | Loan Amount |
|---|---|---|---|
| Previous Owner | Watson David G | $109,971 | |
| Previous Owner | Dowell Virgil L | $109,250 |
Source: Public Records
Tax History
| Year | Tax Paid | Tax Assessment Tax Assessment Total Assessment is a certain percentage of the fair market value that is determined by local assessors to be the total taxable value of land and additions on the property. | Land | Improvement |
|---|---|---|---|---|
| 2025 | $2,233 | $35,383 | $4,799 | $30,584 |
| 2024 | $2,233 | $32,234 | $3,314 | $28,920 |
| 2023 | $2,182 | $32,234 | $4,038 | $28,196 |
| 2022 | $2,007 | $27,170 | $3,463 | $23,707 |
| 2021 | $2,006 | $27,170 | $3,463 | $23,707 |
| 2020 | $1,928 | $25,370 | $3,463 | $21,907 |
| 2019 | $1,897 | $25,370 | $3,463 | $21,907 |
| 2018 | $1,729 | $22,081 | $3,014 | $19,067 |
| 2017 | $1,703 | $22,081 | $3,014 | $19,067 |
| 2016 | $1,703 | $21,527 | $3,523 | $18,004 |
| 2014 | $1,617 | $20,900 | $3,420 | $17,480 |
Source: Public Records
Map
Nearby Homes
- 2944 Iva Ct
- 2916 Sweet Briar Dr
- 3220 S Bryn Mawr Dr
- 2829 Trenchard Dr
- 18809 E 32nd Terrace Ct S
- 2805 Castle Dr
- 3304 S Cochise Ave
- 18608 E 26th Terrace S
- 18401 E 26th Street Ct S
- 18801 E 24th Terrace S
- 2431 S Ponca Ave
- 17813 E 26th St S
- 18008 E 25th Street Ct S
- 3011 Cedar Crest Dr Unit B
- 2309 S Heartland Ct
- 20204 E 23rd Ter Ct S
- 17504 E R D Mize Rd
- 3416 S Maybrook Ave
- 17800 E Bolger Rd Unit 147
- 17800 E Bolger Rd Unit 101
- 19208 E R D Mize Rd
- 3049 Bryn Mawr Dr
- 19205 E 30th Terrace S
- 19209 E 30th Terrace S
- 19212 E R D Mize Rd
- 19213 E 30th Terrace S
- 3037 Bryn Mawr Dr
- 19300 E R D Mize Rd
- 3042 Bryn Mawr Dr
- 3042 S Bryn Mawr Dr
- 19217 E 30th Terrace S
- 19204 E 31st Terrace S
- 19200 E 31st Terrace S
- 3036 Bryn Mawr Dr
- 19300 E 31st Terrace S
- 19212 E 31st Terrace S
- 3048 Bryn Mawr Dr
- 19304 E R D Mize Rd
- 19204 E 30th Terrace S
- 3023 Bryn Mawr Dr
Your Personal Tour Guide
Ask me questions while you tour the home.