1921 C Ave NE Cedar Rapids, IA 52402
Mound View NeighborhoodEstimated Value: $141,000 - $193,000
2
Beds
2
Baths
1,269
Sq Ft
$132/Sq Ft
Est. Value
About This Home
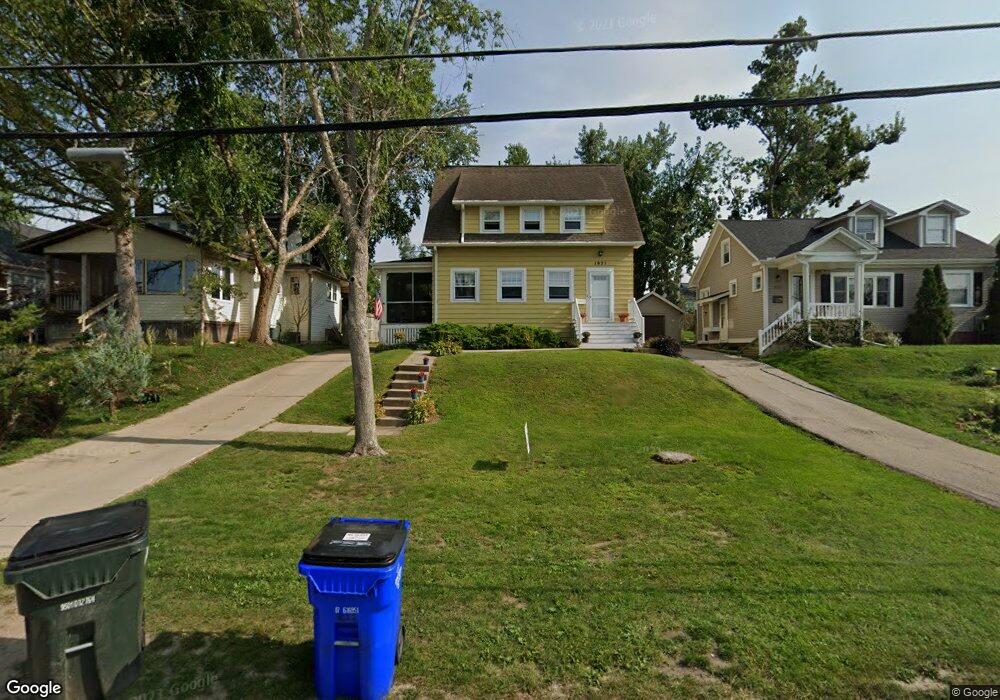
This home is located at 1921 C Ave NE, Cedar Rapids, IA 52402 and is currently estimated at $167,446, approximately $131 per square foot. 1921 C Ave NE is a home located in Linn County with nearby schools including Arthur Elementary School, Franklin Middle School, and George Washington High School.
Ownership History
Date
Name
Owned For
Owner Type
Purchase Details
Closed on
Mar 3, 2022
Sold by
Shawn Snitkey
Bought by
Snitkey Kelly
Current Estimated Value
Home Financials for this Owner
Home Financials are based on the most recent Mortgage that was taken out on this home.
Original Mortgage
$90,000
Outstanding Balance
$84,089
Interest Rate
3.92%
Mortgage Type
New Conventional
Estimated Equity
$83,357
Purchase Details
Closed on
Feb 24, 2003
Sold by
Rasmussen Bruce E and Rasmussen Denise R
Bought by
Snitkey Shawn P and Snitkey Kelly L
Home Financials for this Owner
Home Financials are based on the most recent Mortgage that was taken out on this home.
Original Mortgage
$93,500
Interest Rate
6%
Purchase Details
Closed on
Nov 6, 1998
Sold by
Kelty Kimberly M
Bought by
Rasmussen Bruce E and Rasmussen Denise R
Home Financials for this Owner
Home Financials are based on the most recent Mortgage that was taken out on this home.
Original Mortgage
$83,750
Interest Rate
6.72%
Create a Home Valuation Report for This Property
The Home Valuation Report is an in-depth analysis detailing your home's value as well as a comparison with similar homes in the area
Home Values in the Area
Average Home Value in this Area
Purchase History
| Date | Buyer | Sale Price | Title Company |
|---|---|---|---|
| Snitkey Kelly | -- | None Listed On Document | |
| Snitkey Shawn P | $93,000 | -- | |
| Rasmussen Bruce E | $88,000 | -- |
Source: Public Records
Mortgage History
| Date | Status | Borrower | Loan Amount |
|---|---|---|---|
| Open | Snitkey Kelly | $90,000 | |
| Previous Owner | Snitkey Shawn P | $93,500 | |
| Previous Owner | Rasmussen Bruce E | $83,750 |
Source: Public Records
Tax History Compared to Growth
Tax History
| Year | Tax Paid | Tax Assessment Tax Assessment Total Assessment is a certain percentage of the fair market value that is determined by local assessors to be the total taxable value of land and additions on the property. | Land | Improvement |
|---|---|---|---|---|
| 2025 | $2,042 | $139,600 | $37,000 | $102,600 |
| 2024 | $2,386 | $126,600 | $34,400 | $92,200 |
| 2023 | $2,386 | $125,800 | $34,400 | $91,400 |
| 2022 | $2,272 | $122,000 | $30,600 | $91,400 |
| 2021 | $2,308 | $118,600 | $30,600 | $88,000 |
| 2020 | $2,308 | $113,200 | $25,500 | $87,700 |
| 2019 | $2,178 | $109,600 | $25,500 | $84,100 |
| 2018 | $2,114 | $109,600 | $25,500 | $84,100 |
| 2017 | $2,114 | $105,600 | $25,500 | $80,100 |
| 2016 | $2,111 | $99,300 | $25,500 | $73,800 |
| 2015 | $2,127 | $99,984 | $25,500 | $74,484 |
| 2014 | $1,942 | $104,323 | $25,500 | $78,823 |
| 2013 | $1,986 | $104,323 | $25,500 | $78,823 |
Source: Public Records
Map
Nearby Homes
- 1857 E Ave NE
- 1815 E Ave NE
- 418 21st St NE
- 122 20th St NE
- 205 21st St NE
- 517 18th St NE
- 306 21st St NE
- 1953 1st Ave E Unit 301
- 1953 1st Ave SE Unit 301
- 1953 1st Ave SE Unit 503
- 1746 B Ave NE
- 321 22nd St NE
- 1735 C Ave NE
- 1748 A Ave NE
- 1719 C Ave NE
- 1953 2nd Ave SE
- 1839 K Ave NE
- 1831 2nd Ave SE
- 1703 A Ave NE
- 8821 Zeppelin Ave NE
- 1923 C Ave NE
- 1915 C Ave NE
- 1925 C Ave NE
- 400 Longwood Dr NE
- 1911 C Ave NE
- 1931 C Ave NE
- 403 Longwood Dr NE
- 408 Longwood Dr NE
- 1909 C Ave NE
- 1933 C Ave NE
- 403 Dunreath Dr NE
- 409 Longwood Dr NE
- 1922 B Ave NE
- 1918 B Ave NE
- 1924 B Ave NE
- 1914 B Ave NE
- 1935 C Ave NE
- 414 Longwood Dr NE
- 407 Dunreath Dr NE
- 1928 B Ave NE