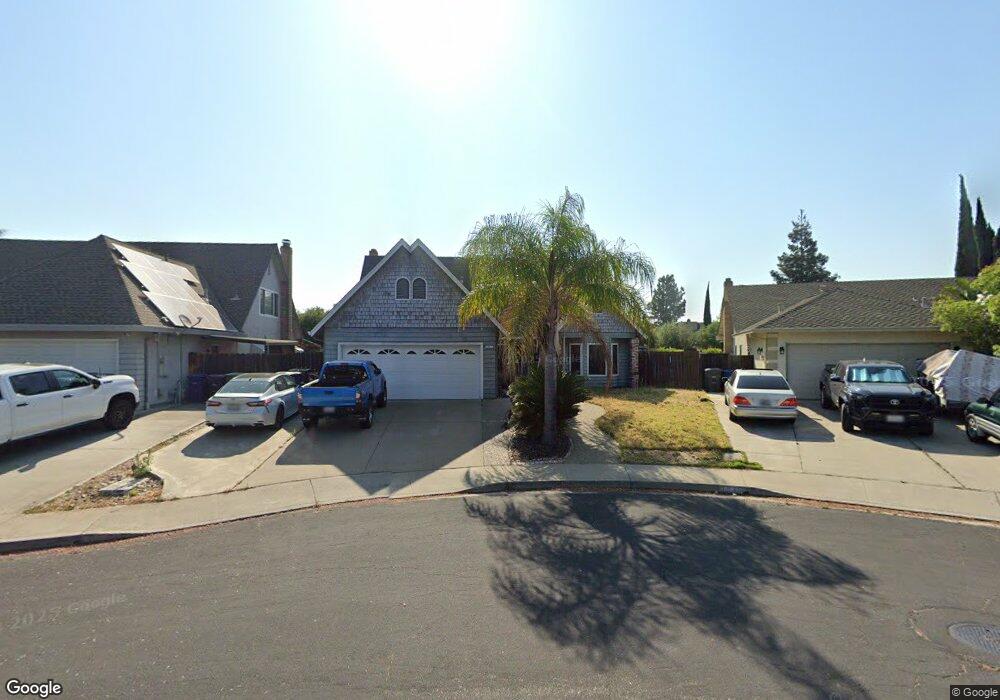
1921 Cypress Ct Oakley, CA 94561
South Oakley NeighborhoodEstimated Value: $639,000 - $687,000
4
Beds
2
Baths
2,136
Sq Ft
$311/Sq Ft
Est. Value
About This Home
This home is located at 1921 Cypress Ct, Oakley, CA 94561 and is currently estimated at $663,735, approximately $310 per square foot. 1921 Cypress Ct is a home located in Contra Costa County with nearby schools including Laurel Elementary School, O'Hara Park Middle School, and Freedom High School.
Ownership History
Date
Name
Owned For
Owner Type
Purchase Details
Closed on
Sep 30, 2015
Sold by
Miller Ronny R and Miller Theresa B
Bought by
Kerrigan Brandon S and Kerrigan Christie A
Current Estimated Value
Home Financials for this Owner
Home Financials are based on the most recent Mortgage that was taken out on this home.
Original Mortgage
$382,936
Outstanding Balance
$300,264
Interest Rate
3.78%
Mortgage Type
FHA
Estimated Equity
$363,471
Purchase Details
Closed on
Mar 27, 1998
Sold by
Dawson Sarah M
Bought by
Miller Ronny R and Miller Theresa B
Home Financials for this Owner
Home Financials are based on the most recent Mortgage that was taken out on this home.
Original Mortgage
$143,600
Interest Rate
10.8%
Mortgage Type
Purchase Money Mortgage
Purchase Details
Closed on
Oct 26, 1994
Sold by
Wise Leonard C and Wise Carol A
Bought by
Dawson Elsie M and Haber Sarah M
Home Financials for this Owner
Home Financials are based on the most recent Mortgage that was taken out on this home.
Original Mortgage
$154,295
Interest Rate
8.7%
Mortgage Type
FHA
Create a Home Valuation Report for This Property
The Home Valuation Report is an in-depth analysis detailing your home's value as well as a comparison with similar homes in the area
Home Values in the Area
Average Home Value in this Area
Purchase History
| Date | Buyer | Sale Price | Title Company |
|---|---|---|---|
| Kerrigan Brandon S | $390,000 | Fidelity National Title Co | |
| Miller Ronny R | $169,000 | Old Republic Title Company | |
| Dawson Elsie M | $157,000 | First American Title Guarant |
Source: Public Records
Mortgage History
| Date | Status | Borrower | Loan Amount |
|---|---|---|---|
| Open | Kerrigan Brandon S | $382,936 | |
| Previous Owner | Miller Ronny R | $143,600 | |
| Previous Owner | Dawson Elsie M | $154,295 | |
| Closed | Miller Ronny R | $8,497 |
Source: Public Records
Tax History
| Year | Tax Paid | Tax Assessment Tax Assessment Total Assessment is a certain percentage of the fair market value that is determined by local assessors to be the total taxable value of land and additions on the property. | Land | Improvement |
|---|---|---|---|---|
| 2025 | $6,088 | $461,677 | $118,377 | $343,300 |
| 2024 | $5,913 | $452,625 | $116,056 | $336,569 |
| 2023 | $5,913 | $443,751 | $113,781 | $329,970 |
| 2022 | $5,865 | $435,050 | $111,550 | $323,500 |
| 2021 | $5,775 | $426,520 | $109,363 | $317,157 |
| 2019 | $5,503 | $413,870 | $106,120 | $307,750 |
| 2018 | $5,358 | $405,756 | $104,040 | $301,716 |
| 2017 | $5,311 | $397,800 | $102,000 | $295,800 |
| 2016 | $5,024 | $390,000 | $100,000 | $290,000 |
| 2015 | $3,198 | $224,380 | $42,504 | $181,876 |
| 2014 | $3,198 | $219,986 | $41,672 | $178,314 |
Source: Public Records
Map
Nearby Homes
- 151 Bedford Ln
- 4509 La Casa Ct
- 4834 Chablis Ct
- 2025 Truman Ln
- 0 Empire Ave Unit 41097524
- 0 Empire Ave Unit 41111855
- 2019 Verona Ct
- 215 Spindrift Ct
- 4855 Edgewood Ct
- 912 Rhine Way
- 4901 Beldin Ln
- 4920 Dawson Dr
- 1425 W Cypress Rd
- 10 Kali Ct
- 5025 Martin St
- 3017 Kenwood Cir
- 104 Genoa Way
- 123 Zartop St
- 0 Main St Unit 41115212
- 1859 Santa fe St
- 1917 Cypress Ct
- 1925 Cypress Ct
- 1929 Cypress Ct
- 1913 Cypress Ct
- 1933 Cypress Ct
- 240 Callia Ct
- 1930 Cypress Ct
- 1885 W Cypress Rd
- 230 Callia Ct
- 1909 Cypress Ct
- 235 Callia Ct
- 1937 Cypress Ct
- 1940 Cypress Ct
- 335 Helena Ct
- 1910 Cypress Ct
- 1905 Cypress Ct
- 220 Callia Ct
- 130 Francis Ct
- 1941 Cypress Ct
- 225 Callia Ct
Your Personal Tour Guide
Ask me questions while you tour the home.