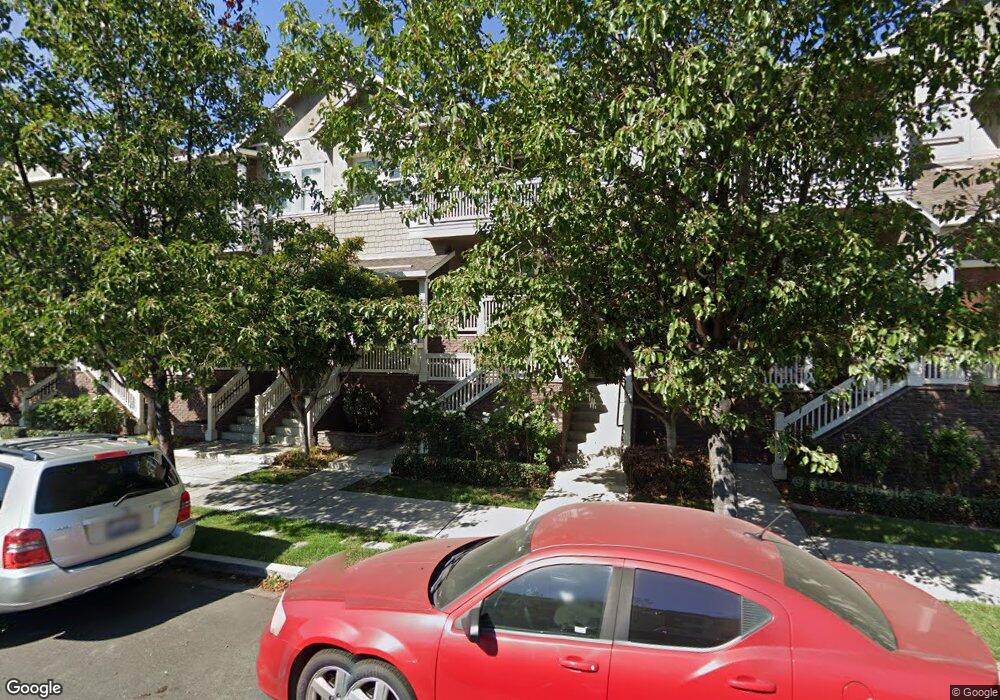
1921 Depot Dr Unit 109 Livermore, CA 94550
Downtown Livermore NeighborhoodEstimated Value: $439,000 - $856,000
3
Beds
2
Baths
1,759
Sq Ft
$406/Sq Ft
Est. Value
About This Home
This home is located at 1921 Depot Dr Unit 109, Livermore, CA 94550 and is currently estimated at $714,683, approximately $406 per square foot. 1921 Depot Dr Unit 109 is a home located in Alameda County with nearby schools including Junction Avenue K-8 School, Granada High School, and St Michael's School.
Ownership History
Date
Name
Owned For
Owner Type
Purchase Details
Closed on
Nov 24, 2008
Sold by
Liquidation Properties Inc
Bought by
Chow Jason J and Chow Janelle
Current Estimated Value
Home Financials for this Owner
Home Financials are based on the most recent Mortgage that was taken out on this home.
Original Mortgage
$276,000
Outstanding Balance
$181,562
Interest Rate
6.04%
Mortgage Type
Purchase Money Mortgage
Estimated Equity
$533,121
Purchase Details
Closed on
Dec 21, 2007
Sold by
Ghoddousi Bejan
Bought by
Citigroup Global Markets Realty
Purchase Details
Closed on
Feb 5, 2007
Sold by
Signature At Station Square Llc
Bought by
Ghoddousi Bejan
Home Financials for this Owner
Home Financials are based on the most recent Mortgage that was taken out on this home.
Original Mortgage
$517,520
Interest Rate
6.84%
Mortgage Type
Balloon
Create a Home Valuation Report for This Property
The Home Valuation Report is an in-depth analysis detailing your home's value as well as a comparison with similar homes in the area
Home Values in the Area
Average Home Value in this Area
Purchase History
| Date | Buyer | Sale Price | Title Company |
|---|---|---|---|
| Chow Jason J | $349,900 | Chicago Title Company | |
| Liquidation Properties Inc | $349,900 | Chicago Title Company | |
| Citigroup Global Markets Realty | $521,100 | Fidelity | |
| Ghoddousi Bejan | $647,000 | First American Title Co |
Source: Public Records
Mortgage History
| Date | Status | Borrower | Loan Amount |
|---|---|---|---|
| Open | Chow Jason J | $276,000 | |
| Previous Owner | Ghoddousi Bejan | $517,520 |
Source: Public Records
Tax History Compared to Growth
Tax History
| Year | Tax Paid | Tax Assessment Tax Assessment Total Assessment is a certain percentage of the fair market value that is determined by local assessors to be the total taxable value of land and additions on the property. | Land | Improvement |
|---|---|---|---|---|
| 2025 | $6,168 | $450,555 | $135,076 | $315,479 |
| 2024 | $6,168 | $441,723 | $132,428 | $309,295 |
| 2023 | $6,104 | $433,063 | $129,832 | $303,231 |
| 2022 | $6,004 | $424,574 | $127,287 | $297,287 |
| 2021 | $5,281 | $416,251 | $124,792 | $291,459 |
| 2020 | $5,686 | $411,985 | $123,513 | $288,472 |
| 2019 | $5,719 | $403,910 | $121,092 | $282,818 |
| 2018 | $5,580 | $395,991 | $118,718 | $277,273 |
| 2017 | $5,482 | $388,227 | $116,390 | $271,837 |
| 2016 | $5,204 | $380,617 | $114,109 | $266,508 |
| 2015 | $4,919 | $374,903 | $112,396 | $262,507 |
| 2014 | $4,892 | $367,562 | $110,195 | $257,367 |
Source: Public Records
Map
Nearby Homes
- 1948 Railroad Ave Unit 104
- 161 N L St Unit 101
- 1727 2nd St
- 428 N P St
- 2145 Linden St
- 342 Adelle St
- 1623 4th St
- 556 Morgan Common
- 1815 Pine St
- 2933 1st St Unit 1004
- 1464 Locust St
- 2878 4th St Unit 1401
- 2908 Worthing Common
- 1244 Locust St
- 974 Ventura Ave
- 1085 Murrieta Blvd Unit 222
- 1085 Murrieta Blvd Unit 205
- 1085 Murrieta Blvd Unit 318
- 2211 College Ave
- 1087 Murrieta Blvd Unit 242
- 1921 Depot Dr Unit 113
- 1921 Depot Dr
- 1921 Depot Dr Unit 115
- 1921 Depot Dr Unit 111
- 1921 Depot Dr Unit 105
- 1921 Depot Dr Unit 101
- 1921 Depot Dr #103 Unit 103
- 1921 Depot Dr #107
- 153 Gillette Place Unit 110
- 153 Gillette Place Unit 106
- 153 Gillette Place Unit 104
- 153 Gillette Place Unit 108
- 153 Gillette Place Unit 112
- 153 Gillette Place Unit 114
- 153 Gillette Place Unit 100
- 153 Gillette Place Unit 102
- 1930 Depot Dr Unit 100
- 1930 Depot Dr Unit 102
- 1930 Depot Dr Unit 104
- 1930 Depot Dr Unit 106