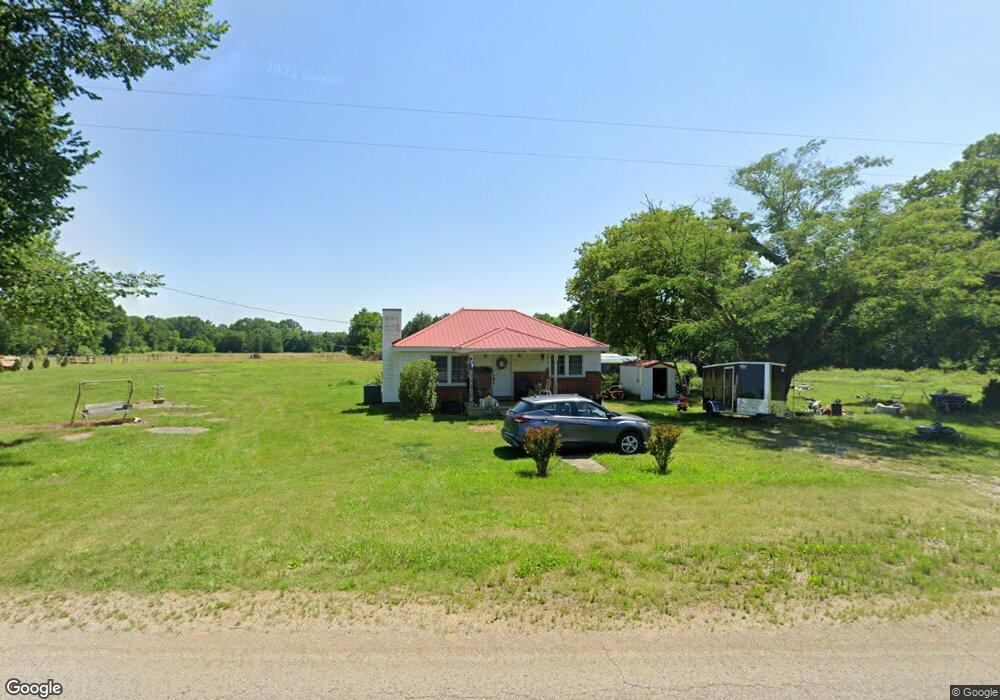
1921 Finley Beech Rd Lewisburg, TN 37091
Estimated Value: $163,000 - $228,000
--
Bed
1
Bath
930
Sq Ft
$203/Sq Ft
Est. Value
About This Home
This home is located at 1921 Finley Beech Rd, Lewisburg, TN 37091 and is currently estimated at $188,367, approximately $202 per square foot. 1921 Finley Beech Rd is a home located in Marshall County with nearby schools including Marshall Elementary School, Oak Grove Elementary School, and Westhills Elementary School.
Ownership History
Date
Name
Owned For
Owner Type
Purchase Details
Closed on
May 3, 2023
Sold by
Sheffield Fred Allen and Sheffield Tina Marie
Bought by
Blackwell Thomas Anthony
Current Estimated Value
Purchase Details
Closed on
Oct 11, 2013
Sold by
Bishop Charles C
Bought by
Sheffield Fred Allen and Sheffield Tina Marie
Purchase Details
Closed on
Apr 11, 2003
Sold by
Johnson William R
Bought by
Nicholas Gillum and Nicholas Dana L
Purchase Details
Closed on
Sep 10, 2002
Sold by
John Gillespie and John Sandra
Bought by
Johnson William R
Purchase Details
Closed on
Sep 17, 2001
Sold by
Gold Bill E
Bought by
Gold Family L P
Purchase Details
Closed on
Feb 20, 2001
Sold by
Clerk & Master
Bought by
Bishop Charles C
Purchase Details
Closed on
Oct 2, 2000
Sold by
Bishop Charles C
Bought by
Johnson William R
Create a Home Valuation Report for This Property
The Home Valuation Report is an in-depth analysis detailing your home's value as well as a comparison with similar homes in the area
Home Values in the Area
Average Home Value in this Area
Purchase History
| Date | Buyer | Sale Price | Title Company |
|---|---|---|---|
| Blackwell Thomas Anthony | -- | None Listed On Document | |
| Blackwell Thomas Anthony | -- | None Listed On Document | |
| Sheffield Fred Allen | $45,000 | -- | |
| Nicholas Gillum | -- | -- | |
| Johnson William R | $37,000 | -- | |
| Gold Family L P | -- | -- | |
| Bishop Charles C | $13,000 | -- | |
| Johnson William R | $40,000 | -- | |
| Bishop Charles C | $13,000 | -- |
Source: Public Records
Tax History Compared to Growth
Tax History
| Year | Tax Paid | Tax Assessment Tax Assessment Total Assessment is a certain percentage of the fair market value that is determined by local assessors to be the total taxable value of land and additions on the property. | Land | Improvement |
|---|---|---|---|---|
| 2024 | $432 | $23,750 | $8,300 | $15,450 |
| 2023 | $545 | $23,750 | $8,300 | $15,450 |
| 2022 | $545 | $29,950 | $14,500 | $15,450 |
| 2021 | $514 | $18,275 | $6,700 | $11,575 |
| 2020 | $526 | $18,275 | $6,700 | $11,575 |
| 2019 | $526 | $18,700 | $6,700 | $12,000 |
| 2018 | $516 | $18,700 | $6,700 | $12,000 |
| 2017 | $516 | $18,700 | $6,700 | $12,000 |
| 2016 | $478 | $14,850 | $5,800 | $9,050 |
| 2015 | $478 | $14,850 | $5,800 | $9,050 |
| 2014 | $473 | $14,700 | $5,800 | $8,900 |
Source: Public Records
Map
Nearby Homes
- 1750 Fayetteville Hwy
- 1946 Fayetteville Hwy
- 1666 Fayetteville Hwy
- 735 Belfast Farmington Rd
- 0 Finley Beech Unit RTC2945449
- 1511 Finley Beech Rd
- 0 Fishing Ford Rd Unit 19689699
- 0 Fishing Ford Rd Unit RTC2891288
- 197 Creekside Dr
- 199 Creekside Dr
- Ashbury Plan at Spring Valley Estates - Grandview Collection
- Primrose Plan at Spring Valley Estates - Classic Collection
- 1011 Curtis Springs Ln
- Alan Plan at Spring Valley Estates - Grandview Collection
- 1013 Curtis Springs Ln
- 1015 Curtis Springs Ln
- 1019 Curtis Springs Ln
- Rosemary Plan at Spring Valley Estates - Classic Collection
- 198 Creekside Dr
- 200 Creekside Dr
- 1929 Finley Beech Rd
- 1898 Finley Beech Rd
- 1858 Finley Beech Rd
- 1 Finley Beech Rd
- 1827 Finley Beech Rd
- 2041 Finley Beech Rd
- 1805 Finley Beech Rd
- 987 Hayes Rd
- 2 Finley Beech Rd
- 2051 Finley Beech Rd
- 1144 Adams Rd
- 1134 Adams Rd
- 1020 Hayes Rd
- 1130 Adams Rd
- 1961 Holly Grove Rd
- 960 Hayes Rd
- 1013 Mooreland St
- 1108 Adams Rd
- 2108 Finley Beech Rd
- 1003 Decatur St