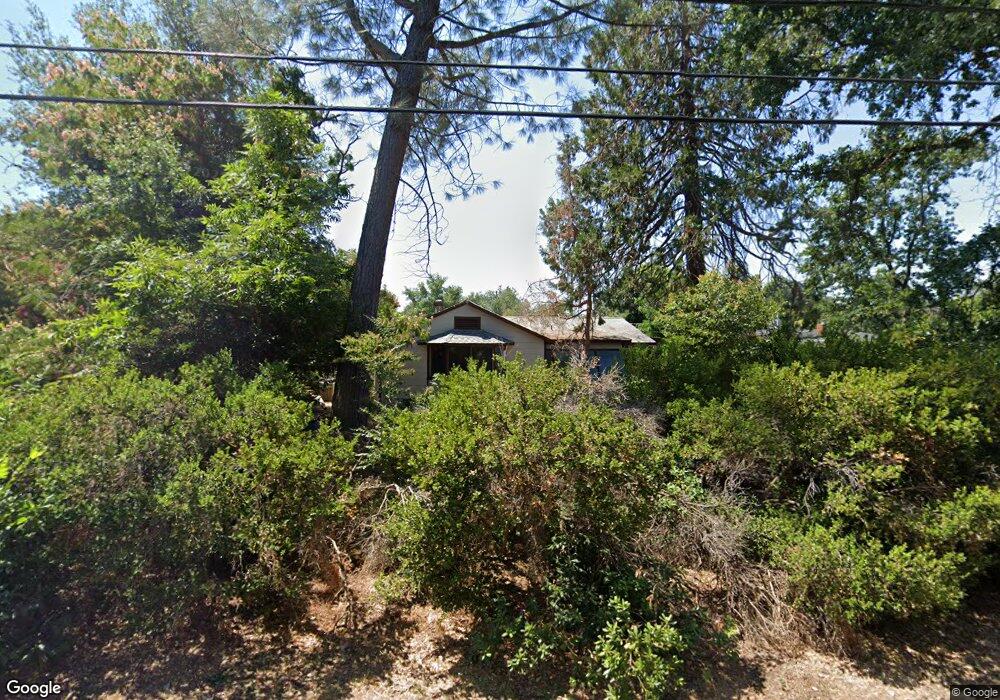
1921 Heller Ln Redding, CA 96001
Branstetter NeighborhoodEstimated Value: $198,790 - $285,000
3
Beds
2
Baths
1,040
Sq Ft
$249/Sq Ft
Est. Value
About This Home
This home is located at 1921 Heller Ln, Redding, CA 96001 and is currently estimated at $258,698, approximately $248 per square foot. 1921 Heller Ln is a home located in Shasta County with nearby schools including Sycamore Elementary School, Sequoia Middle School, and Shasta High School.
Ownership History
Date
Name
Owned For
Owner Type
Purchase Details
Closed on
Oct 27, 2025
Sold by
Duchesneau Living Trust and Duchesneau Donald E
Bought by
Lifton Benjamen Niemiec and Niemiec Stephanie Michelle
Current Estimated Value
Purchase Details
Closed on
Sep 18, 2023
Sold by
Duchesneau David G
Bought by
Duchesneau Living Trust and Duchesneau
Purchase Details
Closed on
Mar 30, 2010
Sold by
Johnson Leslie M and Trausch Robert J
Bought by
Duchesneau David G
Home Financials for this Owner
Home Financials are based on the most recent Mortgage that was taken out on this home.
Original Mortgage
$38,000
Interest Rate
5.01%
Mortgage Type
Purchase Money Mortgage
Purchase Details
Closed on
Jul 23, 2003
Sold by
Trausch Robert and Johnson Leslie
Bought by
Trausch Robert J and Johnson Leslie M
Home Financials for this Owner
Home Financials are based on the most recent Mortgage that was taken out on this home.
Original Mortgage
$41,700
Interest Rate
5.15%
Mortgage Type
Purchase Money Mortgage
Create a Home Valuation Report for This Property
The Home Valuation Report is an in-depth analysis detailing your home's value as well as a comparison with similar homes in the area
Home Values in the Area
Average Home Value in this Area
Purchase History
| Date | Buyer | Sale Price | Title Company |
|---|---|---|---|
| Lifton Benjamen Niemiec | -- | None Listed On Document | |
| Duchesneau Living Trust | -- | None Listed On Document | |
| Duchesneau David G | $38,000 | Bidwell Title & Escrow Co | |
| Trausch Robert J | -- | Multiple |
Source: Public Records
Mortgage History
| Date | Status | Borrower | Loan Amount |
|---|---|---|---|
| Previous Owner | Duchesneau David G | $38,000 | |
| Previous Owner | Trausch Robert J | $41,700 |
Source: Public Records
Tax History
| Year | Tax Paid | Tax Assessment Tax Assessment Total Assessment is a certain percentage of the fair market value that is determined by local assessors to be the total taxable value of land and additions on the property. | Land | Improvement |
|---|---|---|---|---|
| 2025 | $628 | $64,526 | $38,717 | $25,809 |
| 2024 | $616 | $63,261 | $37,958 | $25,303 |
| 2023 | $616 | $62,021 | $37,214 | $24,807 |
| 2022 | $604 | $60,806 | $36,485 | $24,321 |
| 2021 | $598 | $59,615 | $35,770 | $23,845 |
| 2020 | $605 | $59,005 | $35,404 | $23,601 |
| 2019 | $574 | $57,849 | $34,710 | $23,139 |
| 2018 | $576 | $56,716 | $34,030 | $22,686 |
| 2017 | $571 | $55,605 | $33,363 | $22,242 |
| 2016 | $552 | $54,515 | $32,709 | $21,806 |
| 2015 | $544 | $53,697 | $32,218 | $21,479 |
| 2014 | $539 | $52,646 | $31,587 | $21,059 |
Source: Public Records
Map
Nearby Homes
- 5812 Cedars Rd Unit 43
- 5812 Cedars Rd Unit 13
- 5812 Cedars Rd Unit 36
- 5812 Cedars Rd Unit 3
- 2200 Jewell Ln
- 2381 S Bonnyview Rd
- 2237 Jewell Ln
- 764 Branstetter Ln
- 2340 Wilsey Dr
- 4920 Bonnyview Ave
- 2339 North Dr
- 2048 Wilder Dr
- 6405 El Camino Dr
- 5875 Farm House Ln
- 4549 Harrison Ave
- 2415 Marion Ct
- 1400 Riviera Dr
- 4720 Enchanted Way
- 2521 Radio Ln
- 3232 Nicolet Ln
- 1931 Heller Ln
- 5605 Jubilee St Unit 1
- 5605 Jubilee St
- 5592 Jubilee St
- 1863 Heller Ln
- 1941 Heller Ln
- 1920 Heller Ln
- 1910 Heller Ln
- 5614 Jubilee St
- 1930 Heller Ln
- 1859 Heller Ln
- 5639 Jubilee St Unit 1
- 5639 Jubilee St
- 5638 Jubilee St
- 1961 Heller Ln
- 1960 Heller Ln
- 1855 Heller Ln
- 1880 Heller Ln
- 1860 Heller Ln
- 5663 Jubilee St
Your Personal Tour Guide
Ask me questions while you tour the home.