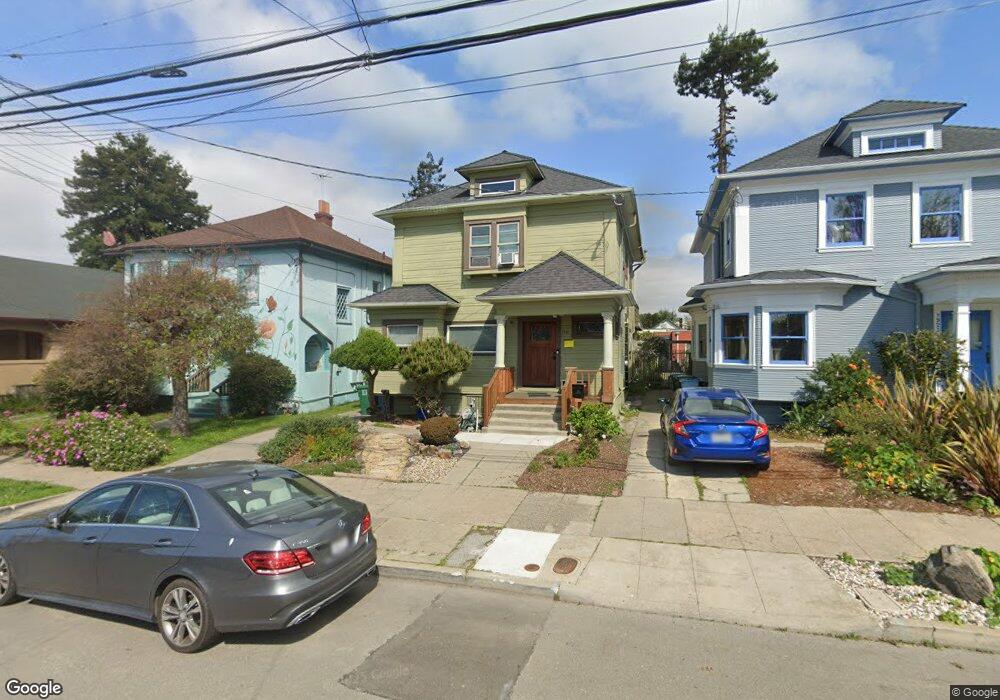
1921 Parker St Berkeley, CA 94704
South Berkeley NeighborhoodEstimated Value: $871,000 - $2,551,000
Studio
--
Bath
3,021
Sq Ft
$535/Sq Ft
Est. Value
About This Home
This home is located at 1921 Parker St, Berkeley, CA 94704 and is currently estimated at $1,615,333, approximately $534 per square foot. 1921 Parker St is a home located in Alameda County with nearby schools including Malcolm X Elementary School, Emerson Elementary School, and John Muir Elementary School.
Ownership History
Date
Name
Owned For
Owner Type
Purchase Details
Closed on
Sep 4, 2014
Sold by
Lim Sungsek S and Lim Sandye S
Bought by
Lim Sungsek S and Lim Colleen
Current Estimated Value
Home Financials for this Owner
Home Financials are based on the most recent Mortgage that was taken out on this home.
Original Mortgage
$105,000
Outstanding Balance
$34,563
Interest Rate
4.1%
Mortgage Type
New Conventional
Estimated Equity
$1,580,770
Purchase Details
Closed on
Dec 6, 2001
Sold by
Lim Sandye S and Sandye S Lim Revocable Trust
Bought by
Lim Sandye S
Home Financials for this Owner
Home Financials are based on the most recent Mortgage that was taken out on this home.
Original Mortgage
$110,000
Interest Rate
6.39%
Create a Home Valuation Report for This Property
The Home Valuation Report is an in-depth analysis detailing your home's value as well as a comparison with similar homes in the area
Home Values in the Area
Average Home Value in this Area
Purchase History
| Date | Buyer | Sale Price | Title Company |
|---|---|---|---|
| Lim Sungsek S | $52,500 | Stewart Title Guaranty | |
| Lim Sandye S | -- | Fidelity National Title Co |
Source: Public Records
Mortgage History
| Date | Status | Borrower | Loan Amount |
|---|---|---|---|
| Open | Lim Sungsek S | $105,000 | |
| Previous Owner | Lim Sandye S | $110,000 |
Source: Public Records
Tax History
| Year | Tax Paid | Tax Assessment Tax Assessment Total Assessment is a certain percentage of the fair market value that is determined by local assessors to be the total taxable value of land and additions on the property. | Land | Improvement |
|---|---|---|---|---|
| 2025 | $10,299 | $370,352 | $59,741 | $317,611 |
| 2024 | $10,299 | $362,953 | $58,569 | $311,384 |
| 2023 | $9,395 | $316,799 | $57,421 | $259,378 |
| 2022 | $5,330 | $122,117 | $56,295 | $72,822 |
| 2021 | $5,288 | $119,585 | $55,191 | $71,394 |
| 2020 | $4,819 | $125,288 | $54,626 | $70,662 |
| 2019 | $4,421 | $122,832 | $53,555 | $69,277 |
| 2018 | $4,291 | $120,423 | $52,505 | $67,918 |
| 2017 | $4,188 | $118,062 | $51,475 | $66,587 |
| 2016 | $3,725 | $115,747 | $50,466 | $65,281 |
| 2015 | $3,649 | $114,009 | $49,708 | $64,301 |
| 2014 | $3,563 | $111,777 | $48,735 | $63,042 |
Source: Public Records
Map
Nearby Homes
- 1901 Parker St Unit 3
- 2018 Blake St
- 2701 Grant St
- 1645 Dwight Way
- 1612 Parker St
- 1612 Carleton St
- 1515 Derby St
- 2926 Ellis St
- 1530 Stuart St
- 2057 Emerson St
- 2923 Wheeler St
- 2110 Ashby Ave
- 2218 -2222 Grant St
- 2319 Ward St
- 2750 Sacramento St
- 1450 Ward St
- 2758 Sacramento St
- 2550 Dana St Unit 2F
- 2774 Sacramento St
- 2782 Sacramento St
Your Personal Tour Guide
Ask me questions while you tour the home.