Estimated Value: $209,000 - $392,000
4
Beds
2
Baths
1,601
Sq Ft
$171/Sq Ft
Est. Value
About This Home
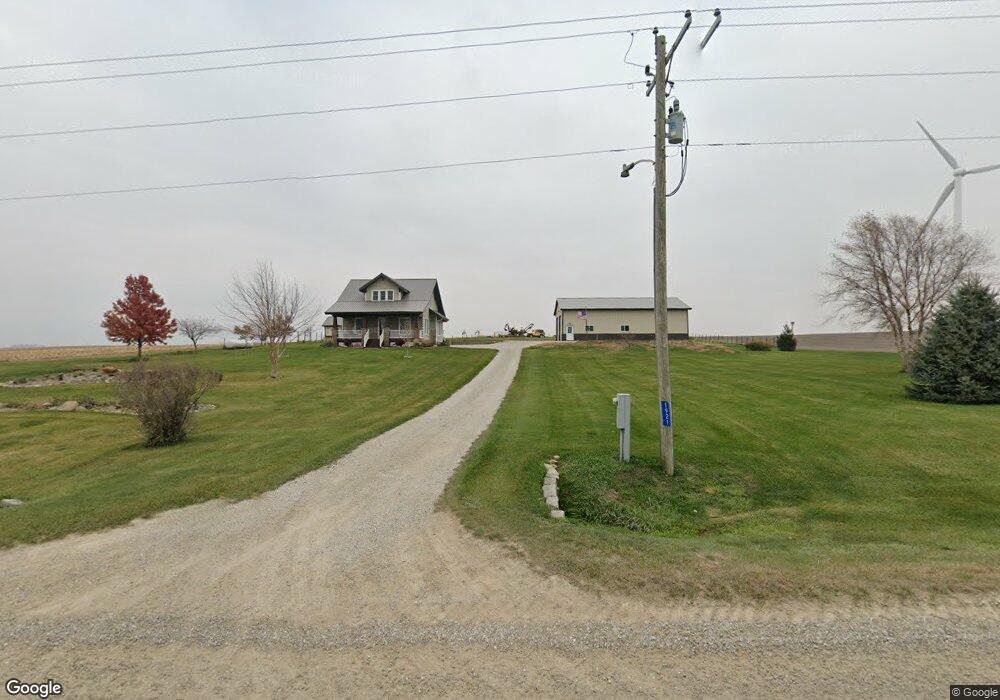
This home is located at 1921 Qq Ave, Traer, IA 50675 and is currently estimated at $273,038, approximately $170 per square foot. 1921 Qq Ave is a home located in Tama County with nearby schools including North Tama Elementary School and North Tama High School.
Ownership History
Date
Name
Owned For
Owner Type
Purchase Details
Closed on
Feb 14, 2025
Sold by
Weida Tony L and Weida Elsa C
Bought by
Vogeler Clayton S and Mcginn Ashley
Current Estimated Value
Home Financials for this Owner
Home Financials are based on the most recent Mortgage that was taken out on this home.
Original Mortgage
$342,865
Outstanding Balance
$145,737
Interest Rate
6.91%
Mortgage Type
Construction
Estimated Equity
$127,301
Purchase Details
Closed on
Nov 18, 2019
Sold by
Habitat For Humanity
Bought by
Weida Tony and Weida Elsa
Create a Home Valuation Report for This Property
The Home Valuation Report is an in-depth analysis detailing your home's value as well as a comparison with similar homes in the area
Home Values in the Area
Average Home Value in this Area
Purchase History
| Date | Buyer | Sale Price | Title Company |
|---|---|---|---|
| Vogeler Clayton S | $339,000 | None Listed On Document | |
| Weida Tony | -- | None Available |
Source: Public Records
Mortgage History
| Date | Status | Borrower | Loan Amount |
|---|---|---|---|
| Open | Vogeler Clayton S | $342,865 |
Source: Public Records
Tax History Compared to Growth
Tax History
| Year | Tax Paid | Tax Assessment Tax Assessment Total Assessment is a certain percentage of the fair market value that is determined by local assessors to be the total taxable value of land and additions on the property. | Land | Improvement |
|---|---|---|---|---|
| 2024 | $2,192 | $193,810 | $41,650 | $152,160 |
| 2023 | $1,936 | $193,810 | $41,650 | $152,160 |
| 2022 | $1,524 | $179,590 | $41,650 | $137,940 |
| 2021 | $1,594 | $141,210 | $30,810 | $110,400 |
| 2020 | $14 | $139,090 | $30,810 | $108,280 |
| 2019 | $1,422 | $119,410 | $0 | $0 |
| 2018 | $1,036 | $92,570 | $0 | $0 |
| 2017 | $1,046 | $90,110 | $0 | $0 |
| 2016 | $994 | $90,110 | $23,700 | $66,410 |
| 2015 | $932 | $90,110 | $23,700 | $66,410 |
| 2014 | $932 | $87,040 | $23,700 | $63,340 |
Source: Public Records
Map
Nearby Homes