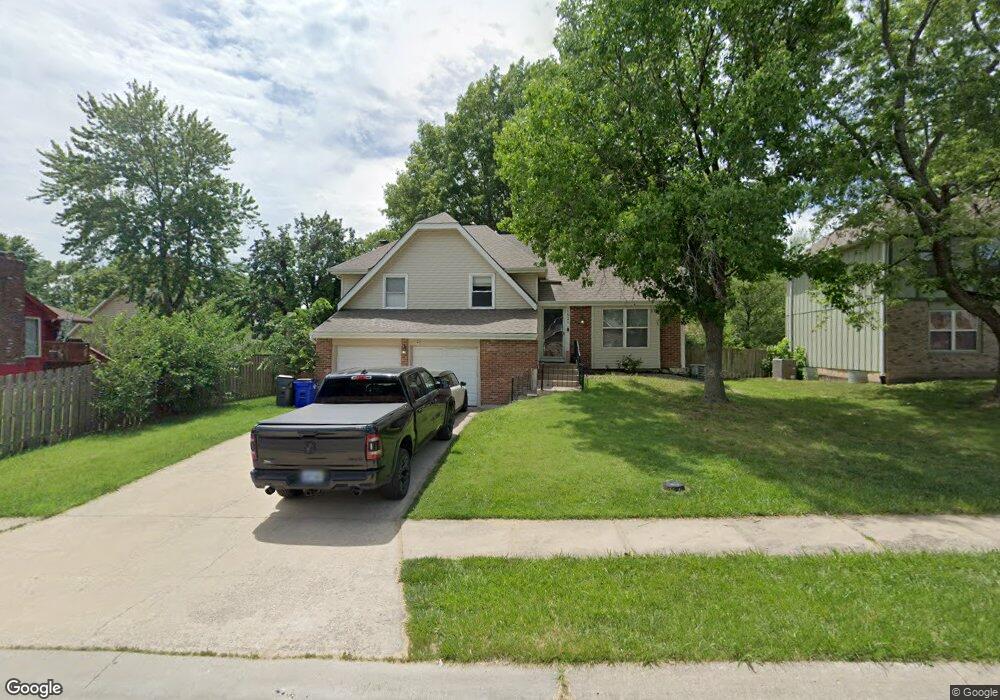
1921 S Lennox Dr Olathe, KS 66062
Estimated Value: $331,245 - $360,000
4
Beds
3
Baths
1,496
Sq Ft
$231/Sq Ft
Est. Value
About This Home
This home is located at 1921 S Lennox Dr, Olathe, KS 66062 and is currently estimated at $346,311, approximately $231 per square foot. 1921 S Lennox Dr is a home located in Johnson County with nearby schools including Scarborough Elementary School, Indian Trail Middle School, and Olathe South Sr High School.
Ownership History
Date
Name
Owned For
Owner Type
Purchase Details
Closed on
Jul 13, 2011
Sold by
Prime Kc Homes L L C
Bought by
Solano Josue
Current Estimated Value
Purchase Details
Closed on
Feb 22, 2011
Sold by
U S Bank National Association Nd
Bought by
Prime Kc Homes L L C
Home Financials for this Owner
Home Financials are based on the most recent Mortgage that was taken out on this home.
Original Mortgage
$130,000
Interest Rate
4.7%
Mortgage Type
Purchase Money Mortgage
Purchase Details
Closed on
Dec 1, 2010
Sold by
Blake Charles H and Blake Sharon E
Bought by
U S Bank National Association Nd
Purchase Details
Closed on
Jun 6, 2006
Sold by
Blake Charles H and Blake Sharon E
Bought by
Blake Charles H and Blake Sharon E
Create a Home Valuation Report for This Property
The Home Valuation Report is an in-depth analysis detailing your home's value as well as a comparison with similar homes in the area
Home Values in the Area
Average Home Value in this Area
Purchase History
| Date | Buyer | Sale Price | Title Company |
|---|---|---|---|
| Solano Josue | -- | Continental Title | |
| Prime Kc Homes L L C | -- | Buffalo Title Llc | |
| U S Bank National Association Nd | $149,000 | None Available | |
| Blake Charles H | -- | None Available |
Source: Public Records
Mortgage History
| Date | Status | Borrower | Loan Amount |
|---|---|---|---|
| Previous Owner | Prime Kc Homes L L C | $130,000 |
Source: Public Records
Tax History Compared to Growth
Tax History
| Year | Tax Paid | Tax Assessment Tax Assessment Total Assessment is a certain percentage of the fair market value that is determined by local assessors to be the total taxable value of land and additions on the property. | Land | Improvement |
|---|---|---|---|---|
| 2024 | $3,838 | $34,442 | $6,464 | $27,978 |
| 2023 | $3,678 | $32,258 | $5,880 | $26,378 |
| 2022 | $3,407 | $29,083 | $5,114 | $23,969 |
| 2021 | $3,397 | $27,542 | $5,114 | $22,428 |
| 2020 | $3,313 | $26,623 | $4,646 | $21,977 |
| 2019 | $2,989 | $23,897 | $3,870 | $20,027 |
| 2018 | $2,895 | $24,173 | $3,872 | $20,301 |
| 2017 | $2,907 | $22,839 | $3,222 | $19,617 |
| 2016 | $2,697 | $21,746 | $3,222 | $18,524 |
| 2015 | $2,505 | $20,228 | $3,222 | $17,006 |
| 2013 | -- | $18,929 | $3,222 | $15,707 |
Source: Public Records
Map
Nearby Homes
- 1625 E 153rd St
- 1411 E 153rd Terrace
- 1904 S Lindenwood Dr
- 1317 E 154th St
- 1836 E 153rd Cir
- 1411 E 155th St
- 1836 E 152nd Cir
- 18504 W 153rd Terrace
- 1413 S Sheridan Bridge Cir
- 18201 W 157th Terrace
- 1820 E Pawnee Dr
- 1317 E Sleepy Hollow Dr
- 2027 E Mohawk Ct
- 1432 E Meadow Ln
- 2157 E 154th St
- 1412 S Pawnee Dr
- 1431 E Wells Fargo Dr
- 1917 E Osage Cir
- 1504 E Wells Fargo Dr
- 1916 E Frontier Ln
- 1917 S Lennox Dr
- 18360 Lone Elm Rd
- C 151st St
- 165 Switzer
- 999999 Ridgeview & 167th St St
- 12908 S Alden St
- 14300 S Pflumm N A
- 1516 E 153rd St
- 1512 E 153rd St
- 178th 178th Terrace
- 12060 W 138 Ct
- Lt 101 Carriage Rd
- 175th Legler St
- 169HWY 183rd St
- 3 dup W Sheridan St
- 1/4 mi W of 135th & Pflumm St
- 13437 W 147th Cir
- NWQ 165th & Britton St
- 1913 S Lennox Dr
- 1936 S Parkwood Dr