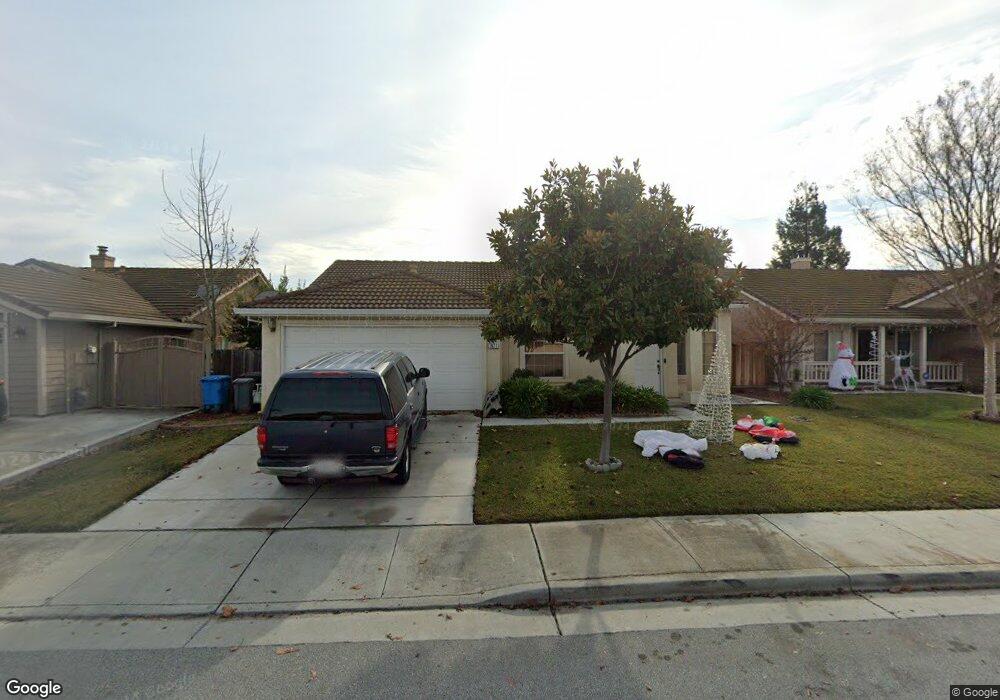
1921 Spruce Dr Hollister, CA 95023
Estimated Value: $620,000 - $712,000
3
Beds
2
Baths
1,334
Sq Ft
$506/Sq Ft
Est. Value
About This Home
This home is located at 1921 Spruce Dr, Hollister, CA 95023 and is currently estimated at $674,847, approximately $505 per square foot. 1921 Spruce Dr is a home located in San Benito County with nearby schools including Cerra Vista Elementary School, Maze Middle School, and San Benito High School.
Ownership History
Date
Name
Owned For
Owner Type
Purchase Details
Closed on
Jul 13, 2009
Sold by
Webster Irene M
Bought by
Gandaria Denice
Current Estimated Value
Home Financials for this Owner
Home Financials are based on the most recent Mortgage that was taken out on this home.
Original Mortgage
$268,367
Outstanding Balance
$175,154
Interest Rate
5.31%
Mortgage Type
Purchase Money Mortgage
Estimated Equity
$499,693
Purchase Details
Closed on
Dec 29, 2003
Sold by
Santana Maria
Bought by
Webster Irene M
Home Financials for this Owner
Home Financials are based on the most recent Mortgage that was taken out on this home.
Original Mortgage
$300,000
Interest Rate
4%
Mortgage Type
New Conventional
Purchase Details
Closed on
May 16, 2000
Sold by
Dituri Eric A
Bought by
Santana Maria
Home Financials for this Owner
Home Financials are based on the most recent Mortgage that was taken out on this home.
Original Mortgage
$261,700
Interest Rate
4.95%
Create a Home Valuation Report for This Property
The Home Valuation Report is an in-depth analysis detailing your home's value as well as a comparison with similar homes in the area
Home Values in the Area
Average Home Value in this Area
Purchase History
| Date | Buyer | Sale Price | Title Company |
|---|---|---|---|
| Gandaria Denice | $263,000 | Chicago Title Company | |
| Webster Irene M | $380,000 | Commonwealth Land Title Co | |
| Santana Maria | $295,000 | Chicago Title Co |
Source: Public Records
Mortgage History
| Date | Status | Borrower | Loan Amount |
|---|---|---|---|
| Open | Gandaria Denice | $268,367 | |
| Previous Owner | Webster Irene M | $300,000 | |
| Previous Owner | Santana Maria | $261,700 |
Source: Public Records
Tax History Compared to Growth
Tax History
| Year | Tax Paid | Tax Assessment Tax Assessment Total Assessment is a certain percentage of the fair market value that is determined by local assessors to be the total taxable value of land and additions on the property. | Land | Improvement |
|---|---|---|---|---|
| 2025 | $4,327 | $346,402 | $154,892 | $191,510 |
| 2023 | $4,327 | $332,952 | $148,878 | $184,074 |
| 2022 | $4,174 | $326,424 | $145,959 | $180,465 |
| 2021 | $4,116 | $320,025 | $143,098 | $176,927 |
| 2020 | $4,132 | $316,744 | $141,631 | $175,113 |
| 2019 | $4,016 | $310,534 | $138,854 | $171,680 |
| 2018 | $3,939 | $304,446 | $136,132 | $168,314 |
| 2017 | $3,886 | $298,477 | $133,463 | $165,014 |
| 2016 | $3,915 | $292,626 | $130,847 | $161,779 |
| 2015 | $3,880 | $288,231 | $128,882 | $159,349 |
| 2014 | $3,675 | $282,586 | $126,358 | $156,228 |
Source: Public Records
Map
Nearby Homes
- 961 Alder St
- 1950 Parkview Cir
- 2171 Spruce Dr
- 2161 Teakwood Ct
- 1251 Mulberry St
- 2181 Osborne Cir
- 1680 El Camino de Vida
- 1870 Hillcrest Rd
- 1090 Los Altos Dr
- 1183 Scout Peak Way
- 1031 Trinity Dr
- Residence 2185 Plan at The Cottages
- Residence 1909 Plan at The Cottages
- Residence 1807 Plan at The Cottages
- Residence 1664 Plan at The Cottages
- 1601 Sunnyslope Rd
- 1575 Sunflower Dr
- The Newport Plan at Santana Ranch - The Cottages
- The Ventura Plan at Santana Ranch - The Cottages
- The Solana Plan at Santana Ranch - The Cottages
- 1931 Spruce Dr
- 1911 Spruce Dr
- 1920 Sycamore Ct
- 1910 Sycamore Ct
- 1941 Spruce Dr
- 1901 Spruce Dr
- 1930 Sycamore Ct
- 1900 Sycamore Ct
- 1910 Spruce Dr
- 1920 Spruce Dr
- 1940 Sycamore Ct
- 1951 Spruce Dr
- 981 Alder St
- 1930 Spruce Dr
- 1950 Sycamore Ct
- 1940 Spruce Dr
- 1961 Spruce Dr
- 971 Alder St
- 1921 Sycamore Ct
- 1911 Sycamore Ct