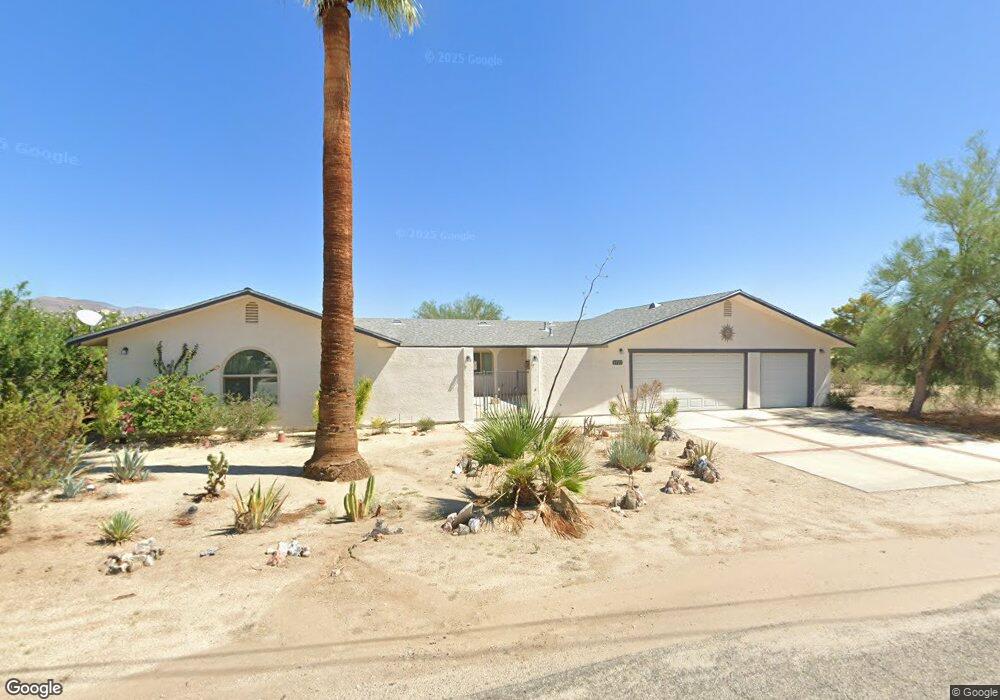
1921 Trebuchet Dr Borrego Springs, CA 92004
Estimated Value: $372,000 - $435,000
3
Beds
2
Baths
1,814
Sq Ft
$221/Sq Ft
Est. Value
About This Home
This home is located at 1921 Trebuchet Dr, Borrego Springs, CA 92004 and is currently estimated at $400,836, approximately $220 per square foot. 1921 Trebuchet Dr is a home located in San Diego County with nearby schools including Borrego Springs Elementary School, Borrego Springs Middle School, and Borrego Springs High School.
Ownership History
Date
Name
Owned For
Owner Type
Purchase Details
Closed on
Apr 1, 2013
Sold by
Jepson Eileen Rex
Bought by
Holly Cameron Lee and Holly Marie Ann
Current Estimated Value
Purchase Details
Closed on
Jun 8, 2011
Sold by
Jepson Eileen Rex
Bought by
Jepson Eileen Rex
Home Financials for this Owner
Home Financials are based on the most recent Mortgage that was taken out on this home.
Original Mortgage
$210,000
Interest Rate
2.43%
Mortgage Type
Reverse Mortgage Home Equity Conversion Mortgage
Purchase Details
Closed on
Sep 5, 2006
Sold by
Jepson Patricia Ann
Bought by
Jepson Eileen Rex
Purchase Details
Closed on
Aug 16, 1999
Sold by
Revocable Trust 08-04-92 Jepson Edward E Nsns
Bought by
Edward E Jepson Revocable Declaration Of
Purchase Details
Closed on
Aug 2, 1996
Sold by
Jepson Edward E and Rex Eileen A
Bought by
Jepson Edward E
Create a Home Valuation Report for This Property
The Home Valuation Report is an in-depth analysis detailing your home's value as well as a comparison with similar homes in the area
Home Values in the Area
Average Home Value in this Area
Purchase History
| Date | Buyer | Sale Price | Title Company |
|---|---|---|---|
| Holly Cameron Lee | $142,500 | Fidelity National Title Co | |
| Jepson Eileen Rex | -- | Placer Title Company | |
| Jepson Eileen Rex | -- | New Century Title Company | |
| Edward E Jepson Revocable Declaration Of | -- | Commonwealth Land Title Ins | |
| Jepson Edward E | -- | Commonwealth Land Title Ins |
Source: Public Records
Mortgage History
| Date | Status | Borrower | Loan Amount |
|---|---|---|---|
| Previous Owner | Jepson Eileen Rex | $210,000 |
Source: Public Records
Tax History Compared to Growth
Tax History
| Year | Tax Paid | Tax Assessment Tax Assessment Total Assessment is a certain percentage of the fair market value that is determined by local assessors to be the total taxable value of land and additions on the property. | Land | Improvement |
|---|---|---|---|---|
| 2025 | $1,949 | $175,464 | $43,093 | $132,371 |
| 2024 | $1,949 | $172,025 | $42,249 | $129,776 |
| 2023 | $1,908 | $168,653 | $41,421 | $127,232 |
| 2022 | $1,881 | $165,347 | $40,609 | $124,738 |
| 2021 | $1,849 | $162,106 | $39,813 | $122,293 |
| 2020 | $1,844 | $160,445 | $39,405 | $121,040 |
| 2019 | $1,718 | $157,300 | $38,633 | $118,667 |
| 2018 | $1,685 | $154,217 | $37,876 | $116,341 |
| 2017 | $1,653 | $151,194 | $37,134 | $114,060 |
| 2016 | $1,616 | $148,230 | $36,406 | $111,824 |
| 2015 | $1,593 | $146,005 | $35,860 | $110,145 |
| 2014 | $1,558 | $143,146 | $35,158 | $107,988 |
Source: Public Records
Map
Nearby Homes
- 2 Lazy Dr S
- 1 Lazy Dr S
- 0 Lazy S Unit NDP2402705
- 2 Hauberk Dr
- 1 Laramie St
- 2039 Lazy Dr S
- 406 Santa fe Trail
- 0 Verbena Dr Unit IV25127409
- 347 Wheel Hub Place
- 341 Ocotillo Cir
- 373 Ocotillo Cir
- 202 Pointing Rock Dr Unit 19
- 202 Pointing Rock Dr Unit 15
- 196 Montezuma Rd
- 1682 Montezuma Ct Unit 13
- 119 Montezuma Rd
- 581 Catarina Dr
- 2490 Hoberg Rd
- 468 Palm Canyon Dr
- 351 Palm Canyon Dr Unit 64
- 1935 Trebuchet Dr
- 1922 Trebuchet Dr
- 1903 St Vincent Dr
- 1903 Saint Vincent Dr
- 1943 Trebuchet Dr
- 1949 Trebuchet Dr
- 1902 Trebuchet Dr
- 1965 Fenoval Dr
- 1901 Trebuchet Dr
- 1955 Fenoval Dr
- 1920 Lazy Dr S
- 1945 Fenoval Dr
- 116 Arbalest Dr
- Lot 165 Lazy Dr S
- 1935 Fenoval Dr
- 1962 Fenoval Dr
- 1976 Fenoval Dr
- 1821 Fenoval Dr
- 393 Arbalest Dr
- 2011 Trebuchet Dr