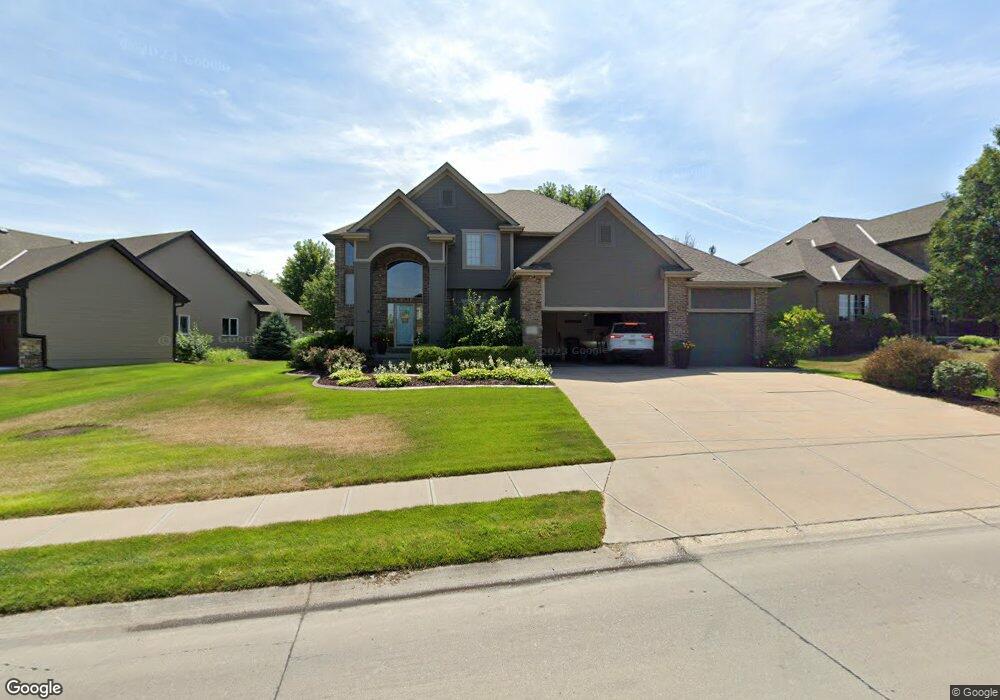
19211 Bellbrook Blvd Gretna, NE 68028
Estimated Value: $513,255 - $572,000
4
Beds
4
Baths
2,911
Sq Ft
$187/Sq Ft
Est. Value
About This Home
This home is located at 19211 Bellbrook Blvd, Gretna, NE 68028 and is currently estimated at $543,064, approximately $186 per square foot. 19211 Bellbrook Blvd is a home located in Sarpy County with nearby schools including Reeder Elementary School, Beadle Middle School, and Millard West High School.
Ownership History
Date
Name
Owned For
Owner Type
Purchase Details
Closed on
Jul 29, 2011
Sold by
Jares John H and Jares Anita M
Bought by
Baker Brandon J and Baker Holly J
Current Estimated Value
Home Financials for this Owner
Home Financials are based on the most recent Mortgage that was taken out on this home.
Original Mortgage
$210,000
Outstanding Balance
$145,130
Interest Rate
4.53%
Estimated Equity
$397,934
Purchase Details
Closed on
Feb 12, 2008
Sold by
Todd Menard Construction Llc
Bought by
Jares John H and Jares Anita M
Home Financials for this Owner
Home Financials are based on the most recent Mortgage that was taken out on this home.
Original Mortgage
$244,000
Interest Rate
5.88%
Purchase Details
Closed on
Apr 19, 2006
Sold by
Paramount Builders Inc
Bought by
Todd Menard Construction Llc
Create a Home Valuation Report for This Property
The Home Valuation Report is an in-depth analysis detailing your home's value as well as a comparison with similar homes in the area
Home Values in the Area
Average Home Value in this Area
Purchase History
| Date | Buyer | Sale Price | Title Company |
|---|---|---|---|
| Baker Brandon J | $285,000 | Nebraska Land Title & Abstra | |
| Jares John H | $305,000 | Ot | |
| Todd Menard Construction Llc | $31,000 | None Available |
Source: Public Records
Mortgage History
| Date | Status | Borrower | Loan Amount |
|---|---|---|---|
| Open | Baker Brandon J | $210,000 | |
| Previous Owner | Jares John H | $244,000 |
Source: Public Records
Tax History Compared to Growth
Tax History
| Year | Tax Paid | Tax Assessment Tax Assessment Total Assessment is a certain percentage of the fair market value that is determined by local assessors to be the total taxable value of land and additions on the property. | Land | Improvement |
|---|---|---|---|---|
| 2025 | $8,174 | $503,993 | $73,000 | $430,993 |
| 2024 | $8,700 | $494,212 | $73,000 | $421,212 |
| 2023 | $8,700 | $434,304 | $60,000 | $374,304 |
| 2022 | $8,485 | $393,292 | $55,000 | $338,292 |
| 2021 | $7,963 | $365,066 | $53,500 | $311,566 |
| 2020 | $8,007 | $358,043 | $53,500 | $304,543 |
| 2019 | $7,922 | $353,526 | $53,500 | $300,026 |
| 2018 | $8,200 | $352,856 | $44,000 | $308,856 |
| 2017 | $8,226 | $346,991 | $44,000 | $302,991 |
| 2016 | $8,067 | $338,327 | $42,000 | $296,327 |
| 2015 | $8,169 | $332,465 | $42,000 | $290,465 |
| 2014 | $8,271 | $322,654 | $42,000 | $280,654 |
| 2012 | -- | $312,977 | $38,000 | $274,977 |
Source: Public Records
Map
Nearby Homes
- 7112 S 193rd St
- 18921 Lillian St
- 19603 Brookside Ln
- 10416 S 191st St
- 19654 Chandler St
- 10219 S 191st St
- 18710 Lillian St
- 18713 Edna St
- 7819 S 194th Ave
- 19821 Emiline St
- 8004 S 195th St
- 7354 S 185th St
- 7358 S 185th St
- 8023 S 193rd St
- 4549 S 203rd St
- 4505 S 203rd St
- 4538 S 203rd St
- 4522 S 203rd St
- 18514 Olive Cir
- 18809 Briar St
- 19207 Bellbrook Blvd
- 19215 Bellbrook Blvd
- 19203 Bellbrook Blvd
- 19219 Bellbrook Blvd
- 19208 Bellbrook Blvd
- 19212 Bellbrook Blvd
- 19204 Bellbrook Blvd
- 19301 Bellbrook Blvd
- 19224 Olive Plaza
- 7209 S 193 St
- 7209 193
- 7209 S 193rd St
- 19305 Bellbrook Blvd
- 7205 S 193rd St
- 7210 S 193rd St
- 7302 S 191st St
- 19112 Josephine St
- 7306 S 191st St
- 7210 S 193 St
- 7310 S 191st St