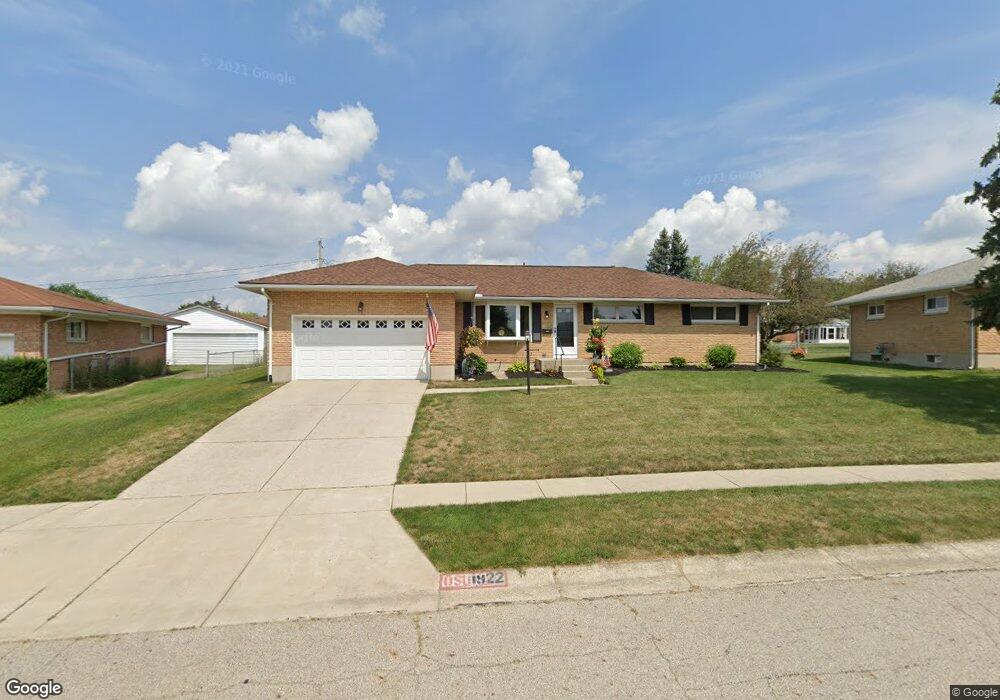
1922 Kimberly Cir Springfield, OH 45503
Estimated Value: $229,000 - $270,000
3
Beds
2
Baths
1,547
Sq Ft
$163/Sq Ft
Est. Value
About This Home
This home is located at 1922 Kimberly Cir, Springfield, OH 45503 and is currently estimated at $252,337, approximately $163 per square foot. 1922 Kimberly Cir is a home located in Clark County with nearby schools including Rolling Hills Elementary School, Northridge Elementary School, and Northridge Middle School.
Ownership History
Date
Name
Owned For
Owner Type
Purchase Details
Closed on
Nov 30, 2021
Sold by
Trinkle James M and Trinkle Janet L
Bought by
Adams Francine R
Current Estimated Value
Home Financials for this Owner
Home Financials are based on the most recent Mortgage that was taken out on this home.
Original Mortgage
$149,000
Outstanding Balance
$127,588
Interest Rate
3.09%
Mortgage Type
New Conventional
Estimated Equity
$124,749
Purchase Details
Closed on
Aug 20, 2015
Sold by
Hites Rodney H and Hites Rodney H
Bought by
Trinkle James M and Trinkle Janet L
Home Financials for this Owner
Home Financials are based on the most recent Mortgage that was taken out on this home.
Original Mortgage
$107,900
Interest Rate
4.04%
Mortgage Type
New Conventional
Purchase Details
Closed on
Jul 7, 2008
Sold by
Hites Rodney H and Hites Rodney H
Bought by
Hites Rodney H
Purchase Details
Closed on
Oct 19, 1993
Sold by
Hites Rodney H and Hites Dorothy E
Bought by
Hites Rodney H and Hites Dorothy E
Create a Home Valuation Report for This Property
The Home Valuation Report is an in-depth analysis detailing your home's value as well as a comparison with similar homes in the area
Home Values in the Area
Average Home Value in this Area
Purchase History
| Date | Buyer | Sale Price | Title Company |
|---|---|---|---|
| Adams Francine R | $199,900 | Team Ttl & Closing Svcs Llc | |
| Trinkle James M | $119,900 | Attorney | |
| Hites Rodney H | -- | Attorney | |
| Hites Rodney H | -- | -- |
Source: Public Records
Mortgage History
| Date | Status | Borrower | Loan Amount |
|---|---|---|---|
| Open | Adams Francine R | $149,000 | |
| Previous Owner | Trinkle James M | $107,900 |
Source: Public Records
Tax History Compared to Growth
Tax History
| Year | Tax Paid | Tax Assessment Tax Assessment Total Assessment is a certain percentage of the fair market value that is determined by local assessors to be the total taxable value of land and additions on the property. | Land | Improvement |
|---|---|---|---|---|
| 2024 | $2,471 | $58,430 | $10,720 | $47,710 |
| 2023 | $2,471 | $58,430 | $10,720 | $47,710 |
| 2022 | $2,480 | $58,430 | $10,720 | $47,710 |
| 2021 | $2,327 | $46,460 | $8,510 | $37,950 |
| 2020 | $2,329 | $46,460 | $8,510 | $37,950 |
| 2019 | $2,373 | $46,460 | $8,510 | $37,950 |
| 2018 | $2,062 | $38,750 | $7,630 | $31,120 |
| 2017 | $1,767 | $41,262 | $7,630 | $33,632 |
| 2016 | $1,755 | $41,262 | $7,630 | $33,632 |
| 2015 | $1,730 | $39,106 | $7,336 | $31,770 |
| 2014 | $1,730 | $39,106 | $7,336 | $31,770 |
| 2013 | $845 | $39,106 | $7,336 | $31,770 |
Source: Public Records
Map
Nearby Homes
- 4249 Reno Rd
- 1640 Montego Dr
- 4321 Tulane Rd
- 4050 Tacoma St
- 3963 Covington Dr Unit 3963
- 4438 Tacoma St
- 1835 Sierra Ave
- 1781 Pinehurst Dr
- 4446 Ridgewood Rd E Unit 3
- 4644 Middle Urbana Rd
- 1461 Student Ave
- 4512 Ridgewood Rd E
- 4524 Ridgewood Rd E
- 4620 Eldora Dr
- 4620 Eldora St
- 3500 Oakmont Ct
- 1503 Kingsgate Rd
- 1928 Kimberly Cir
- 1916 Kimberly Cir
- 4148 Phoenix Dr
- 4160 Phoenix Dr
- 4134 Phoenix Dr
- 1936 Kimberly Cir
- 1927 Kimberly Cir
- 1908 Kimberly Cir
- 1919 Kimberly Cir
- 1911 Kimberly Cir
- 4122 Phoenix Dr
- 4182 Phoenix Dr
- 1951 Kimberly Cir
- 1942 Kimberly Cir
- 4151 Phoenix Dr
- 1902 Kimberly Cir
- 1902 Kimberly Cr
- 1969 Kimberly Cir
- 4110 Phoenix Dr
- 4131 Phoenix Dr