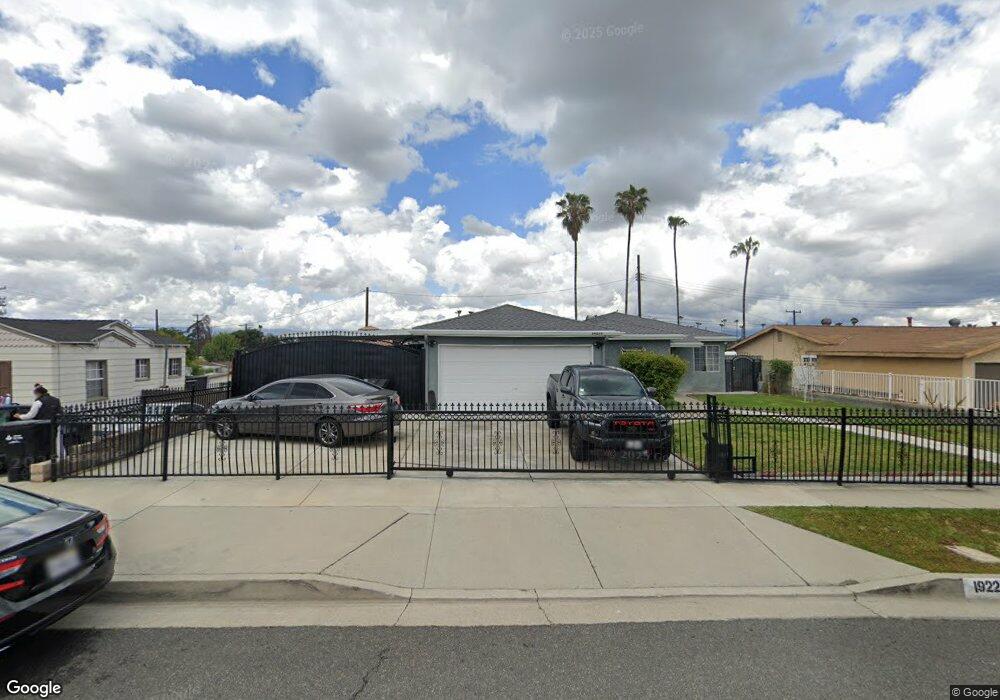
19225 Tranbarger St Rowland Heights, CA 91748
Estimated Value: $779,000 - $936,000
3
Beds
2
Baths
1,091
Sq Ft
$758/Sq Ft
Est. Value
About This Home
This home is located at 19225 Tranbarger St, Rowland Heights, CA 91748 and is currently estimated at $827,444, approximately $758 per square foot. 19225 Tranbarger St is a home located in Los Angeles County with nearby schools including Killian Elementary School, Alvarado Intermediate School, and John A. Rowland High School.
Ownership History
Date
Name
Owned For
Owner Type
Purchase Details
Closed on
Feb 6, 2021
Sold by
Zenh Quan Edna
Bought by
Edna Zenh Quan Family Trust
Current Estimated Value
Purchase Details
Closed on
Apr 20, 2005
Sold by
Genesis Gene Investments Llc
Bought by
Quan Edna
Home Financials for this Owner
Home Financials are based on the most recent Mortgage that was taken out on this home.
Original Mortgage
$305,000
Interest Rate
5.99%
Mortgage Type
Fannie Mae Freddie Mac
Purchase Details
Closed on
Nov 29, 2004
Sold by
Conway Timothy P and Conway Valonne A
Bought by
Genesis Gene Investments Llc
Home Financials for this Owner
Home Financials are based on the most recent Mortgage that was taken out on this home.
Original Mortgage
$250,000
Interest Rate
5.76%
Mortgage Type
Purchase Money Mortgage
Create a Home Valuation Report for This Property
The Home Valuation Report is an in-depth analysis detailing your home's value as well as a comparison with similar homes in the area
Home Values in the Area
Average Home Value in this Area
Purchase History
| Date | Buyer | Sale Price | Title Company |
|---|---|---|---|
| Edna Zenh Quan Family Trust | -- | None Listed On Document | |
| Quan Edna | $415,000 | Fidelity National Title Co | |
| Genesis Gene Investments Llc | $370,000 | Ticor Title Company Of Calif |
Source: Public Records
Mortgage History
| Date | Status | Borrower | Loan Amount |
|---|---|---|---|
| Previous Owner | Quan Edna | $305,000 | |
| Previous Owner | Genesis Gene Investments Llc | $250,000 |
Source: Public Records
Tax History Compared to Growth
Tax History
| Year | Tax Paid | Tax Assessment Tax Assessment Total Assessment is a certain percentage of the fair market value that is determined by local assessors to be the total taxable value of land and additions on the property. | Land | Improvement |
|---|---|---|---|---|
| 2025 | $7,236 | $578,456 | $462,771 | $115,685 |
| 2024 | $7,236 | $567,115 | $453,698 | $113,417 |
| 2023 | $6,991 | $555,996 | $444,802 | $111,194 |
| 2022 | $6,836 | $545,095 | $436,081 | $109,014 |
| 2021 | $6,725 | $534,408 | $427,531 | $106,877 |
| 2019 | $6,521 | $518,559 | $414,851 | $103,708 |
| 2018 | $6,101 | $497,000 | $399,000 | $98,000 |
| 2016 | $5,901 | $480,000 | $385,000 | $95,000 |
| 2015 | $5,322 | $431,000 | $346,000 | $85,000 |
| 2014 | $5,280 | $420,000 | $337,000 | $83,000 |
Source: Public Records
Map
Nearby Homes
- 1560 Otterbein Ave Unit 8
- 1560 Otterbein Ave Unit 12
- 1560 S Otterbein Ave Unit 153
- 1560 S Otterbein Ave Unit 58
- 1560 S Otterbein Ave Unit 113
- 1560 S Otterbein Ave Unit 170
- 1560 S Otterbein Ave Unit 44
- 1308 Golden Coast Ln
- 19319 Temre Ln
- 19527 Cronin Dr
- 1703 Hollandale Ave
- 1441 Paso Real Ave Unit 186
- 1441 Paso Real Ave Unit 72
- 1441 Paso Real Ave Unit 327
- 1441 Paso Real Ave Unit 203
- 1441 Paso Real Ave Unit 159
- 1441 Paso Real Ave Unit 37
- 1441 Paso Real Ave Unit 40
- 1441 Paso Real Ave Unit 271
- 1441 Paso Real Ave Unit 7
- 19231 Tranbarger St
- 19219 Tranbarger St
- 1365 Electra Ave
- 1371 Electra Ave
- 19237 Tranbarger St
- 1361 Electra Ave
- 1377 Electra Ave
- 1364 Otterbein Ave
- 1368 Otterbein Ave
- 19222 Tranbarger St
- 19218 Tranbarger St
- 1360 Otterbein Ave
- 19232 Tranbarger St
- 19214 Tranbarger St
- 1383 Carvin Ave
- 1359 Electra Ave
- 1389 Carvin Ave
- 1377 Carvin Ave
- 19238 Tranbarger St
- 1352 Otterbein Ave