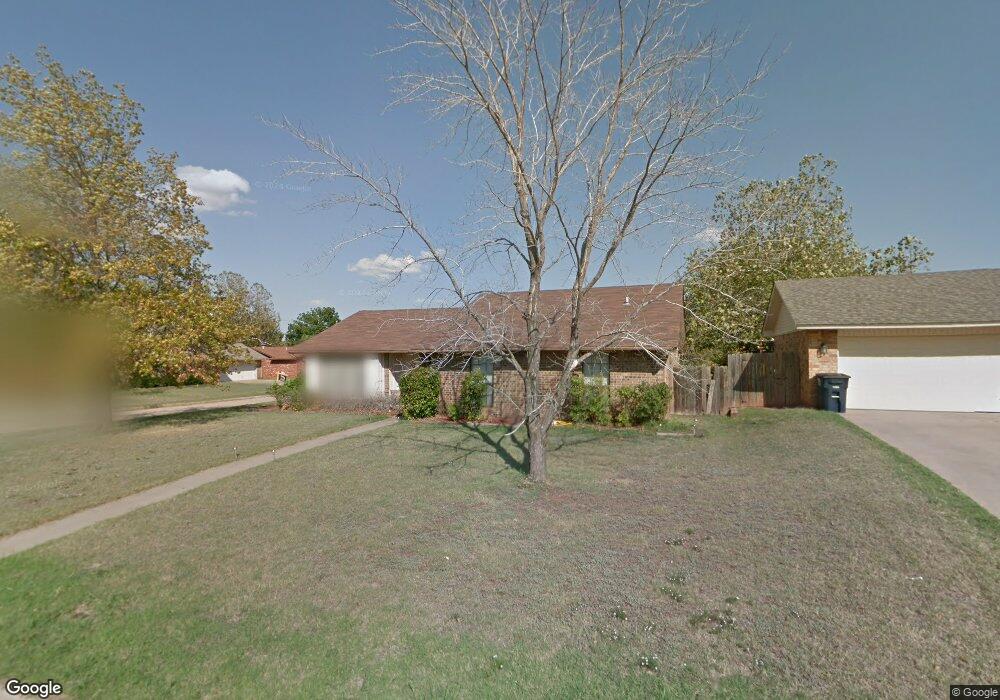
1923 Chandler Cir Shawnee, OK 74801
Estimated Value: $165,671 - $180,000
3
Beds
2
Baths
1,428
Sq Ft
$119/Sq Ft
Est. Value
About This Home
This home is located at 1923 Chandler Cir, Shawnee, OK 74801 and is currently estimated at $170,168, approximately $119 per square foot. 1923 Chandler Cir is a home located in Pottawatomie County with nearby schools including Sequoyah Elementary School, Shawnee Middle School, and Shawnee High School.
Ownership History
Date
Name
Owned For
Owner Type
Purchase Details
Closed on
Feb 12, 2010
Sold by
Walkup Amy Lynn and Mcanally Jamie Nichole
Bought by
Morgan Lisa
Current Estimated Value
Home Financials for this Owner
Home Financials are based on the most recent Mortgage that was taken out on this home.
Original Mortgage
$102,040
Outstanding Balance
$67,971
Interest Rate
5.16%
Mortgage Type
New Conventional
Estimated Equity
$102,197
Purchase Details
Closed on
Jan 30, 2006
Sold by
Underwood Charles R
Bought by
Walkup Amy Lynn and Mcanally Jamie Nichole
Home Financials for this Owner
Home Financials are based on the most recent Mortgage that was taken out on this home.
Original Mortgage
$88,609
Interest Rate
6.24%
Mortgage Type
FHA
Purchase Details
Closed on
May 4, 1994
Sold by
Underwood William and Underwood Ruth
Bought by
Underwood William and Underwood Ruth
Create a Home Valuation Report for This Property
The Home Valuation Report is an in-depth analysis detailing your home's value as well as a comparison with similar homes in the area
Home Values in the Area
Average Home Value in this Area
Purchase History
| Date | Buyer | Sale Price | Title Company |
|---|---|---|---|
| Morgan Lisa | $100,000 | None Available | |
| Walkup Amy Lynn | $90,000 | None Available | |
| Underwood William | -- | -- |
Source: Public Records
Mortgage History
| Date | Status | Borrower | Loan Amount |
|---|---|---|---|
| Open | Morgan Lisa | $102,040 | |
| Previous Owner | Walkup Amy Lynn | $88,609 |
Source: Public Records
Tax History Compared to Growth
Tax History
| Year | Tax Paid | Tax Assessment Tax Assessment Total Assessment is a certain percentage of the fair market value that is determined by local assessors to be the total taxable value of land and additions on the property. | Land | Improvement |
|---|---|---|---|---|
| 2024 | $1,158 | $12,450 | $1,020 | $11,430 |
| 2023 | $1,158 | $12,087 | $1,020 | $11,067 |
| 2022 | $1,116 | $11,882 | $1,020 | $10,862 |
| 2021 | $1,062 | $11,536 | $1,020 | $10,516 |
| 2020 | $1,087 | $11,755 | $1,020 | $10,735 |
| 2019 | $1,169 | $12,193 | $1,020 | $11,173 |
| 2018 | $1,160 | $12,338 | $1,020 | $11,318 |
| 2017 | $1,173 | $12,620 | $1,020 | $11,600 |
| 2016 | $1,167 | $12,432 | $1,020 | $11,412 |
| 2015 | $1,121 | $12,210 | $930 | $11,280 |
| 2014 | $1,086 | $11,855 | $935 | $10,920 |
Source: Public Records
Map
Nearby Homes
- 1824 E Remington St
- 0 Robinwood Place
- 711 N Cleveland Ave
- 703 N Roosevelt Ave
- 42 Mojave Dr
- 29 Dakota Dr
- 648 N Cleveland Ave
- 17 Mojave Dr
- 9 Country Club Rd
- 2400 Augusta
- 1181 Augusta Ct
- 1306 E Wallace St
- 2309 Pinehurst Ct
- 1253 Augusta Ct
- 1322 E Margaret St
- 1320 E Margaret St
- 1314 E Margaret St
- 2500 E Highland St
- 0 E Fay St
- 1307 Laverne Ave
- 1921 Chandler Cir
- 811 Madeline Dr
- 1919 Chandler Cir
- 1912 E Chandler Dr
- 1908 E Chandler Dr
- 1914 E Chandler Dr
- 1905 Chandler Cir
- 1907 Chandler Cir
- 1917 Chandler Cir
- 1906 E Chandler Dr
- 1916 E Chandler Dr
- 1909 Chandler Cir
- 1904 E Chandler Dr
- 1903 E Chandler Dr
- 1915 Chandler Cir
- 15 Delaware Dr
- 17 Delaware Dr
- 1911 Chandler Cir
- 1918 E Chandler Dr
- 13 Delaware Dr