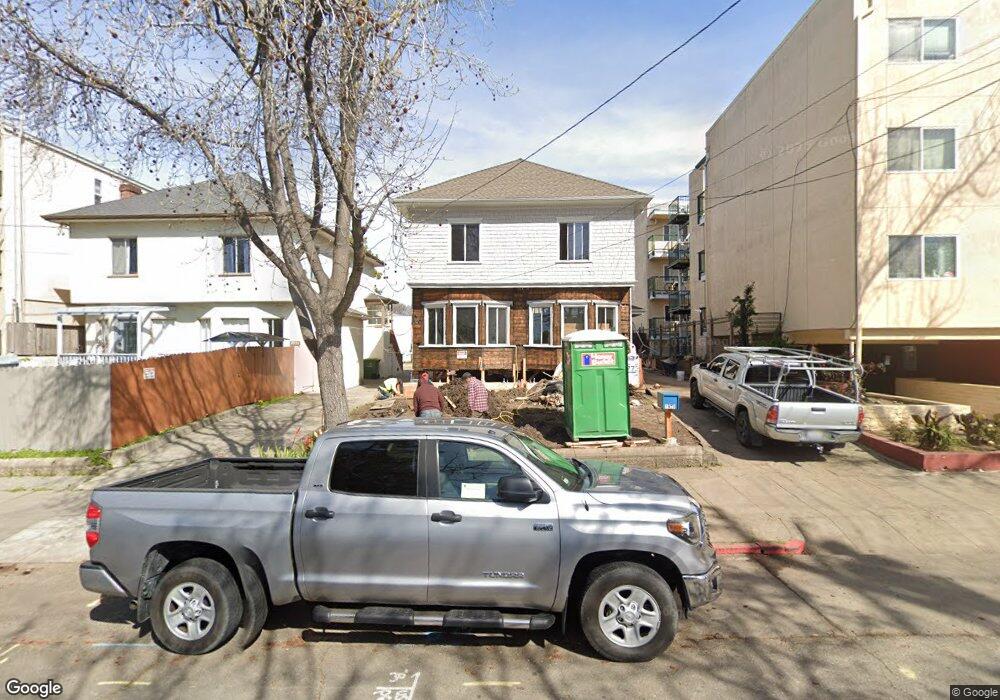
1923 Dwight Way Berkeley, CA 94704
Downtown Berkeley NeighborhoodEstimated Value: $1,063,000 - $1,507,107
3
Beds
2
Baths
2,012
Sq Ft
$647/Sq Ft
Est. Value
About This Home
This home is located at 1923 Dwight Way, Berkeley, CA 94704 and is currently estimated at $1,301,277, approximately $646 per square foot. 1923 Dwight Way is a home located in Alameda County with nearby schools including Washington Elementary School, Malcolm X Elementary School, and Berkeley Arts Magnet at Whittier School.
Ownership History
Date
Name
Owned For
Owner Type
Purchase Details
Closed on
May 25, 2023
Sold by
Noyes Trust
Bought by
Magiera Seng 2020 Trust
Current Estimated Value
Purchase Details
Closed on
May 12, 2016
Sold by
Noyes William J
Bought by
Noyes William J and Noyes Alice
Purchase Details
Closed on
Jan 7, 2003
Sold by
Kirschner Vicky and Noyes Trust
Bought by
Noyes Eileen and Noyes Trust
Purchase Details
Closed on
Sep 17, 2002
Sold by
Noyes Eileen and Noyes Trust
Bought by
Noyes Eileen and Eileen Noyes Survivors Trust
Purchase Details
Closed on
Oct 8, 1996
Sold by
Joseph Hargrove Gary and Joseph C
Bought by
Kirschner Vicky and The Noyes Trust
Purchase Details
Closed on
Apr 18, 1996
Sold by
Hargrove Jean
Bought by
Smith C Joseph and The Jean Hargrove 1996 Trust
Purchase Details
Closed on
May 20, 1994
Sold by
Hargrove Jean
Bought by
Hargrove Jean
Create a Home Valuation Report for This Property
The Home Valuation Report is an in-depth analysis detailing your home's value as well as a comparison with similar homes in the area
Home Values in the Area
Average Home Value in this Area
Purchase History
| Date | Buyer | Sale Price | Title Company |
|---|---|---|---|
| Magiera Seng 2020 Trust | $1,150,000 | Chicago Title | |
| Noyes William J | -- | None Available | |
| Noyes William J | -- | None Available | |
| Noyes Eileen | -- | -- | |
| Noyes Eileen | -- | -- | |
| Kirschner Vicky | $90,000 | First American Title | |
| Smith C Joseph | -- | -- | |
| Hargrove Jean | -- | -- | |
| Hargrove Jean | -- | -- | |
| Hargrove Jean | -- | -- |
Source: Public Records
Tax History
| Year | Tax Paid | Tax Assessment Tax Assessment Total Assessment is a certain percentage of the fair market value that is determined by local assessors to be the total taxable value of land and additions on the property. | Land | Improvement |
|---|---|---|---|---|
| 2025 | $18,266 | $1,196,460 | $358,938 | $837,522 |
| 2024 | $18,266 | $1,173,000 | $351,900 | $821,100 |
| 2023 | $6,727 | $226,725 | $67,780 | $158,945 |
| 2022 | $7,160 | $222,279 | $66,451 | $155,828 |
| 2021 | $7,128 | $217,921 | $65,148 | $152,773 |
| 2020 | $6,638 | $215,687 | $64,480 | $151,207 |
| 2019 | $6,238 | $211,459 | $63,216 | $148,243 |
| 2018 | $6,069 | $207,314 | $61,977 | $145,337 |
| 2017 | $5,834 | $203,250 | $60,762 | $142,488 |
| 2016 | $5,522 | $199,266 | $59,571 | $139,695 |
| 2015 | $5,414 | $196,273 | $58,676 | $137,597 |
| 2014 | $5,261 | $192,429 | $57,527 | $134,902 |
Source: Public Records
Map
Nearby Homes
- 2018 Blake St
- 1901 Parker St Unit 3
- 1645 Dwight Way
- 2701 Grant St
- 2218 -2222 Grant St
- 1612 Parker St
- 1612 Carleton St
- 2550 Dana St Unit 2F
- 2319 Ward St
- 2118 California St
- 1515 Derby St
- 2350 Sacramento St
- 2702 Dana St
- 2535 Chilton Way
- 2923 Wheeler St
- 1530 Stuart St
- 2110 Ashby Ave
- 2926 Ellis St
- 2509 Dwight Way
- 2057 Emerson St
- 1921 Dwight Way
- 1927 Dwight Way
- 2435 Martin Luther King jr Way
- 2489 Martin Luther King jr Way
- 1901 Dwight Way
- 2433 Martin Luther King jr Way
- 1910 Haste St Unit 1/2
- 1910 Haste St
- 1908 Haste St
- 2441 Martin Luther King Junior Way
- 1932 Haste St
- 2429 Martin Luther King jr Way
- 1936 Haste St
- 2450 Milvia St
- 1921 Haste St
- 1940 Haste St
- 1919 Haste St
- 1923 Haste St Unit 3
- 1923 Haste St Unit 2
- 1915 Haste St
Your Personal Tour Guide
Ask me questions while you tour the home.