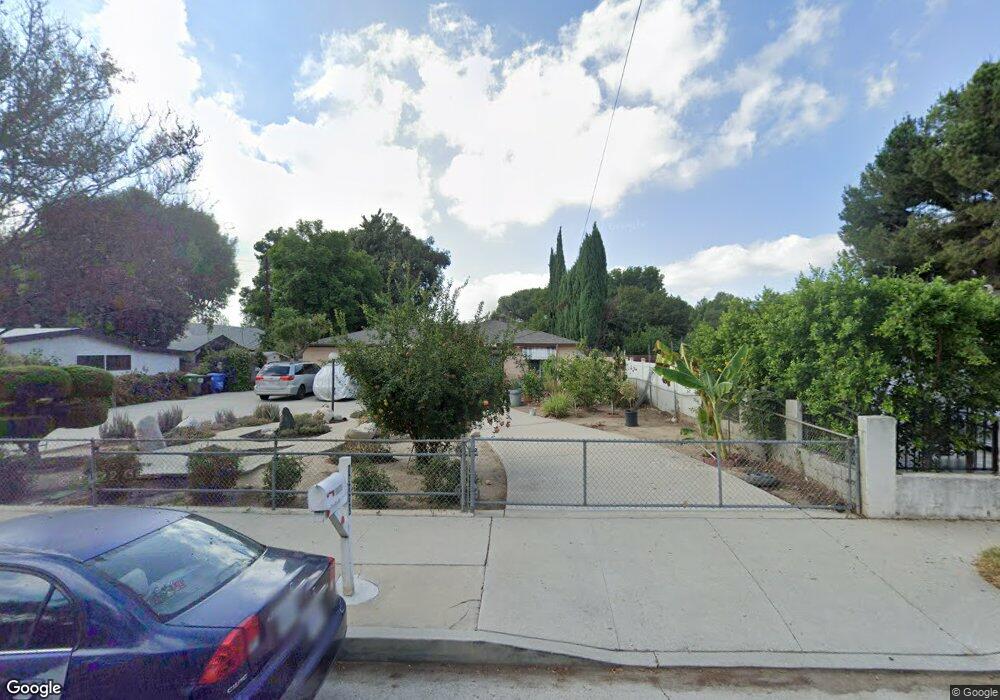
19230 Strathern St Reseda, CA 91335
Estimated Value: $979,000 - $1,527,000
5
Beds
2
Baths
2,079
Sq Ft
$616/Sq Ft
Est. Value
About This Home
This home is located at 19230 Strathern St, Reseda, CA 91335 and is currently estimated at $1,279,771, approximately $615 per square foot. 19230 Strathern St is a home located in Los Angeles County with nearby schools including Melvin Avenue Elementary School, John A. Sutter Middle School, and Northridge Academy High.
Ownership History
Date
Name
Owned For
Owner Type
Purchase Details
Closed on
Jun 30, 2018
Sold by
Pham Huong T
Bought by
Pham Huong T and Hung T Pham 2018 Trust
Current Estimated Value
Purchase Details
Closed on
Sep 29, 2015
Sold by
Nguyen Cuong Ngoc
Bought by
Pham Huong T
Purchase Details
Closed on
Aug 8, 2014
Sold by
Pham Hung
Bought by
Pham Thuy Kim and Thuy Kim Pham Trust
Purchase Details
Closed on
Dec 14, 2005
Sold by
Nguyen Cuong Ngoc
Bought by
The Cuong Ngoc Living Trust
Purchase Details
Closed on
Feb 3, 2005
Sold by
Vannguyen Oanh
Bought by
The Oanh Van Nguyen Living Trust
Purchase Details
Closed on
Apr 13, 2004
Sold by
Nguyen Kim Thoa
Bought by
Vannguyen Oanh
Purchase Details
Closed on
Aug 4, 2003
Sold by
Huynh Kim Thuy and Pham Kim Thuy
Bought by
Pham Hung
Purchase Details
Closed on
Sep 4, 1998
Sold by
Huynh Trung Huu
Bought by
Pham Kim Thuy
Create a Home Valuation Report for This Property
The Home Valuation Report is an in-depth analysis detailing your home's value as well as a comparison with similar homes in the area
Home Values in the Area
Average Home Value in this Area
Purchase History
| Date | Buyer | Sale Price | Title Company |
|---|---|---|---|
| Pham Huong T | -- | None Available | |
| Pham Huong T | -- | None Available | |
| Pham Thuy Kim | -- | None Available | |
| The Cuong Ngoc Living Trust | -- | None Available | |
| Nguyen Cuong Ngoc | -- | None Available | |
| The Oanh Van Nguyen Living Trust | -- | -- | |
| Vannguyen Oanh | -- | Ticor Title Company | |
| Pham Hung | -- | -- | |
| Pham Kim Thuy | -- | -- |
Source: Public Records
Tax History
| Year | Tax Paid | Tax Assessment Tax Assessment Total Assessment is a certain percentage of the fair market value that is determined by local assessors to be the total taxable value of land and additions on the property. | Land | Improvement |
|---|---|---|---|---|
| 2025 | $7,574 | $596,008 | $339,911 | $256,097 |
| 2024 | $7,574 | $584,323 | $333,247 | $251,076 |
| 2023 | $7,435 | $572,866 | $326,713 | $246,153 |
| 2022 | $7,106 | $561,634 | $320,307 | $241,327 |
| 2021 | $7,015 | $550,623 | $314,027 | $236,596 |
| 2019 | $6,814 | $534,293 | $304,714 | $229,579 |
| 2018 | $6,543 | $523,818 | $298,740 | $225,078 |
| 2016 | $4,383 | $347,268 | $211,488 | $135,780 |
| 2015 | $4,321 | $342,053 | $208,312 | $133,741 |
| 2014 | $4,348 | $335,354 | $204,232 | $131,122 |
Source: Public Records
Map
Nearby Homes
- 19211 Strathern St
- 8008 Aura Ave
- 19106 Cantara St
- 19158 Roscoe Blvd
- 8240 Chamberlain Ln
- 19462 Arminta St
- 19516 Blythe St
- 19046 Schoenborn St
- 8356 Vanalden Ave
- 7959 Bothwell Rd
- 8119 Geyser Ave
- 7645 Wilbur Ave
- 7535 Vanalden Ave
- 7527 Tampa Ave Unit 1
- 7551 Donna Ave
- 7514 Beckford Ave
- 7650 Wilbur Ave
- 19620 Roscoe Blvd Unit D
- 7508 Claire Ave
- 19006 Eccles St
- 19222 Strathern St
- 19238 Strathern St
- 19216 Strathern St
- 19227 Strathern St
- 19235 Strathern St
- 19210 Strathern St
- 19219 Strathern St
- 19258 Strathern St
- 19241 Strathern St
- 7946 Tampa Ave
- 19247 Strathern St
- 7938 Tampa Ave
- 7960 Tampa Ave
- 19202 Strathern St
- 7934 Tampa Ave
- 19201 Strathern St
- 7924 Tampa Ave
- 19154 Strathern St
- 19215 1/2 Arminta St
- 7916 Tampa Ave
Your Personal Tour Guide
Ask me questions while you tour the home.