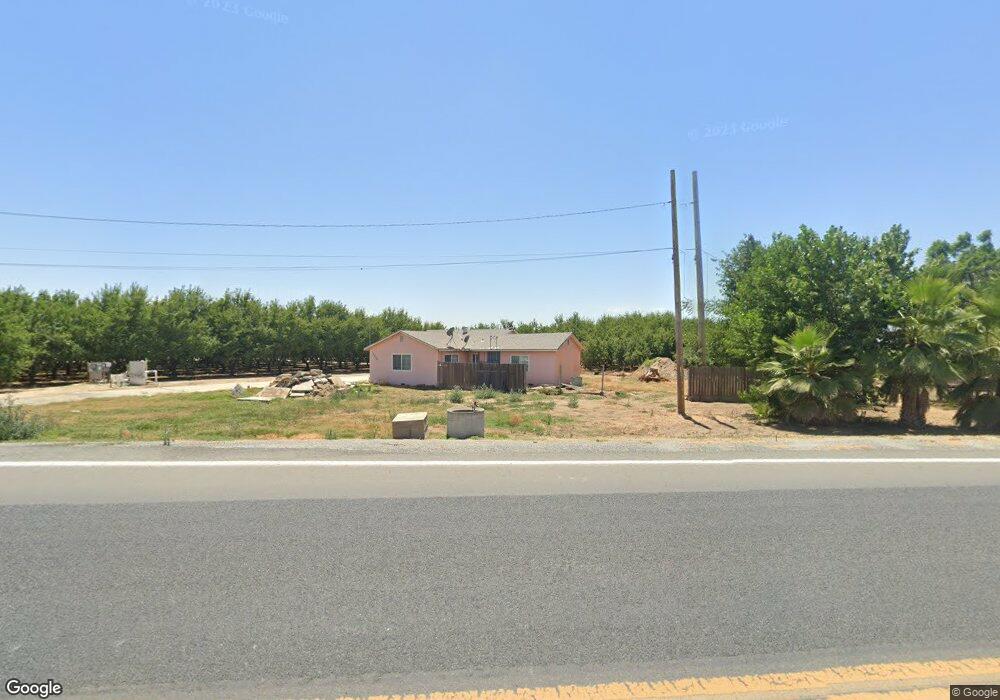
19239 Spacer Dr Tulare, CA 93274
Estimated Value: $511,000
3
Beds
2
Baths
1,248
Sq Ft
$409/Sq Ft
Est. Value
About This Home
This home is located at 19239 Spacer Dr, Tulare, CA 93274 and is currently estimated at $511,000, approximately $409 per square foot. 19239 Spacer Dr is a home located in Tulare County with nearby schools including Cypress Elementary School, Alpine Vista School, and Mission Oak High School.
Ownership History
Date
Name
Owned For
Owner Type
Purchase Details
Closed on
Oct 26, 2021
Sold by
Nieman Theresa Rene
Bought by
Powell Mary
Current Estimated Value
Purchase Details
Closed on
Oct 22, 2021
Sold by
Sytsma Duco
Bought by
Sytsma Laurie A
Purchase Details
Closed on
Sep 21, 2021
Sold by
Mendonca Natalie
Bought by
Mendonca David A
Purchase Details
Closed on
Aug 16, 2021
Sold by
Mendonca Cathlene
Bought by
Mendonca Anthony N and Mendonca David A
Purchase Details
Closed on
Aug 11, 1998
Sold by
Mendonca Benedict
Bought by
Mendonca Antonio S and Mendonca Marjorie J
Purchase Details
Closed on
May 31, 1996
Sold by
Mendonca Benedict and Mendonca Maria De F
Bought by
Mendonca Benedict and Mendonca Maria De F
Create a Home Valuation Report for This Property
The Home Valuation Report is an in-depth analysis detailing your home's value as well as a comparison with similar homes in the area
Home Values in the Area
Average Home Value in this Area
Purchase History
| Date | Buyer | Sale Price | Title Company |
|---|---|---|---|
| Powell Mary | -- | None Available | |
| Brown Shirley | -- | Chicago Title | |
| Sytsma Laurie A | -- | Chicago Title Company | |
| Mendonca David A | -- | Chicago Title Company | |
| Mendonca Anthony N | -- | Chicago Title | |
| Mendonca Anthony N | $1,000,000 | Chicago Title Company | |
| Mendonca Anthony A | $1,000,000 | Chicago Title Company | |
| Mendonca Anthony N | $1,000,000 | Chicago Title Company | |
| Mendonca Antonio S | -- | -- | |
| Mendonca Benedict | -- | -- |
Source: Public Records
Tax History Compared to Growth
Tax History
| Year | Tax Paid | Tax Assessment Tax Assessment Total Assessment is a certain percentage of the fair market value that is determined by local assessors to be the total taxable value of land and additions on the property. | Land | Improvement |
|---|---|---|---|---|
| 2025 | $3,177 | $291,912 | $143,055 | $148,857 |
| 2024 | $3,177 | $286,189 | $140,250 | $145,939 |
| 2023 | $1,663 | $150,691 | $113,019 | $37,672 |
| 2022 | $1,614 | $147,737 | $110,803 | $36,934 |
| 2021 | $1,593 | $144,840 | $108,630 | $36,210 |
| 2020 | $1,620 | $143,355 | $107,516 | $35,839 |
| 2019 | $1,661 | $140,544 | $105,408 | $35,136 |
| 2018 | $1,634 | $137,788 | $103,341 | $34,447 |
| 2017 | $1,619 | $135,087 | $101,315 | $33,772 |
| 2016 | $1,548 | $132,438 | $99,328 | $33,110 |
| 2015 | $1,496 | $130,449 | $97,836 | $32,613 |
| 2014 | $1,496 | $127,894 | $95,920 | $31,974 |
Source: Public Records
Map
Nearby Homes
- 0 Road 112 Unit 202510708
- 0 Road 112 Unit 11681417
- 0 Road 112 Unit 232822
- 900 E Rankin Rd Unit 3
- 900 E Rankin Rd Unit 18
- 900 E Rankin Rd Unit 26
- 900 E Rankin Rd Unit 72
- 900 E Rankin Rd Unit 69
- 900 E Rankin Rd
- 900 E Rankin Rd Unit 5
- 900 E Rankin Rd Unit 134
- 900 E Rankin Rd Unit 30
- 1968 Tahoe Ave
- 1797 Clearwater St
- 014 S Laspina St
- 182330014 S Laspina St
- 0 Ca-99 Unit 237484
- 0 Ca-99 Unit 202500357
- 1849 Softwind Dr
- 1851 Softwind Dr