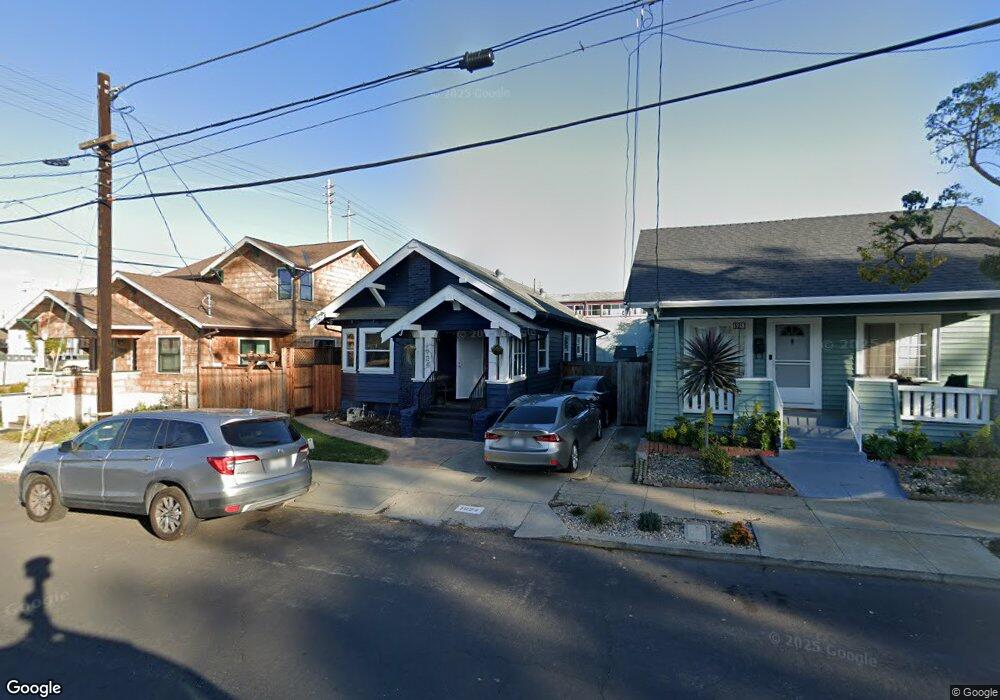
1924 Chestnut St Alameda, CA 94501
West Alameda NeighborhoodEstimated Value: $735,000 - $962,000
2
Beds
2
Baths
1,053
Sq Ft
$795/Sq Ft
Est. Value
About This Home
This home is located at 1924 Chestnut St, Alameda, CA 94501 and is currently estimated at $837,183, approximately $795 per square foot. 1924 Chestnut St is a home located in Alameda County with nearby schools including Love Elementary, Will C. Wood Middle School, and Alameda High School.
Ownership History
Date
Name
Owned For
Owner Type
Purchase Details
Closed on
Mar 14, 2016
Sold by
Sawyer Margaret and Sawyer Katherine
Bought by
Brunetti Nicholas B and Sawyer Katherine
Current Estimated Value
Home Financials for this Owner
Home Financials are based on the most recent Mortgage that was taken out on this home.
Original Mortgage
$417,000
Outstanding Balance
$330,819
Interest Rate
3.72%
Mortgage Type
New Conventional
Estimated Equity
$506,364
Purchase Details
Closed on
Mar 12, 2016
Sold by
Sawyer Margaret and Sawyer Katherine
Bought by
Sawyer Margaret and Sawyer Katherine
Home Financials for this Owner
Home Financials are based on the most recent Mortgage that was taken out on this home.
Original Mortgage
$417,000
Outstanding Balance
$330,819
Interest Rate
3.72%
Mortgage Type
New Conventional
Estimated Equity
$506,364
Purchase Details
Closed on
Jun 23, 2010
Sold by
Sawyer Katherine
Bought by
Sawyer Katherine and Sawyer Margaret
Purchase Details
Closed on
Mar 23, 2001
Sold by
Rundle Stella B
Bought by
Rundle Stella B and Sawyer Margaret Ann
Create a Home Valuation Report for This Property
The Home Valuation Report is an in-depth analysis detailing your home's value as well as a comparison with similar homes in the area
Home Values in the Area
Average Home Value in this Area
Purchase History
| Date | Buyer | Sale Price | Title Company |
|---|---|---|---|
| Brunetti Nicholas B | -- | Fidelity National Title Co | |
| Sawyer Margaret | -- | None Available | |
| Sawyer Katherine | -- | None Available | |
| Rundle Stella B | -- | -- |
Source: Public Records
Mortgage History
| Date | Status | Borrower | Loan Amount |
|---|---|---|---|
| Open | Brunetti Nicholas B | $417,000 |
Source: Public Records
Tax History
| Year | Tax Paid | Tax Assessment Tax Assessment Total Assessment is a certain percentage of the fair market value that is determined by local assessors to be the total taxable value of land and additions on the property. | Land | Improvement |
|---|---|---|---|---|
| 2025 | $2,293 | $42,314 | $29,911 | $19,403 |
| 2024 | $2,293 | $41,348 | $29,325 | $19,023 |
| 2023 | $2,243 | $47,400 | $28,750 | $18,650 |
| 2022 | $2,205 | $39,470 | $28,186 | $18,284 |
| 2021 | $2,171 | $38,560 | $27,634 | $17,926 |
| 2020 | $2,148 | $45,092 | $27,350 | $17,742 |
| 2019 | $1,804 | $44,208 | $26,814 | $17,394 |
| 2018 | $1,772 | $43,341 | $26,288 | $17,053 |
| 2017 | $1,734 | $42,492 | $25,773 | $16,719 |
| 2016 | $1,731 | $36,659 | $25,268 | $11,391 |
| 2015 | $1,717 | $36,108 | $24,888 | $11,220 |
| 2014 | $1,685 | $35,401 | $24,401 | $11,000 |
Source: Public Records
Map
Nearby Homes
- 2025 Stanford St
- 2053 Clement Ave
- 2256 Stanford St
- 2358 Stanford St
- 1933 Grand St
- 1937 Grand St
- 1821 Grand St
- 1670 Larkspur St
- 1660 Clement Ave
- 1707 Lincoln Ave
- 2136 Pacific Ave
- 2050 Central Ave
- 2118 Alameda Ave
- 1401 Cottage St Unit D
- 610 Grand St
- 1211 Paru St
- 1500 Alameda Ave Unit G
- 1606 Morton St
- 1203 Benton St
- 340 29th Ave Unit 204
- 1918 Chestnut St
- 1926 Chestnut St
- 2006 Clement Ave
- 1916 Chestnut St
- 1919 Chestnut St
- 1902 Chestnut St
- 2005 Eagle Ave
- 1917 Chestnut St
- 1910 Clement Ave
- 2011 Eagle Ave
- 1911 Chestnut St
- 1907 Chestnut St
- 2015 Eagle Ave
- 1909 Chestnut St
- 2017 Eagle Ave
- 1905 Chestnut St
- 2007 Stanford St
- 2019 Eagle Ave
- 2022 Clement Ave
- 1924 Lafayette St
Your Personal Tour Guide
Ask me questions while you tour the home.