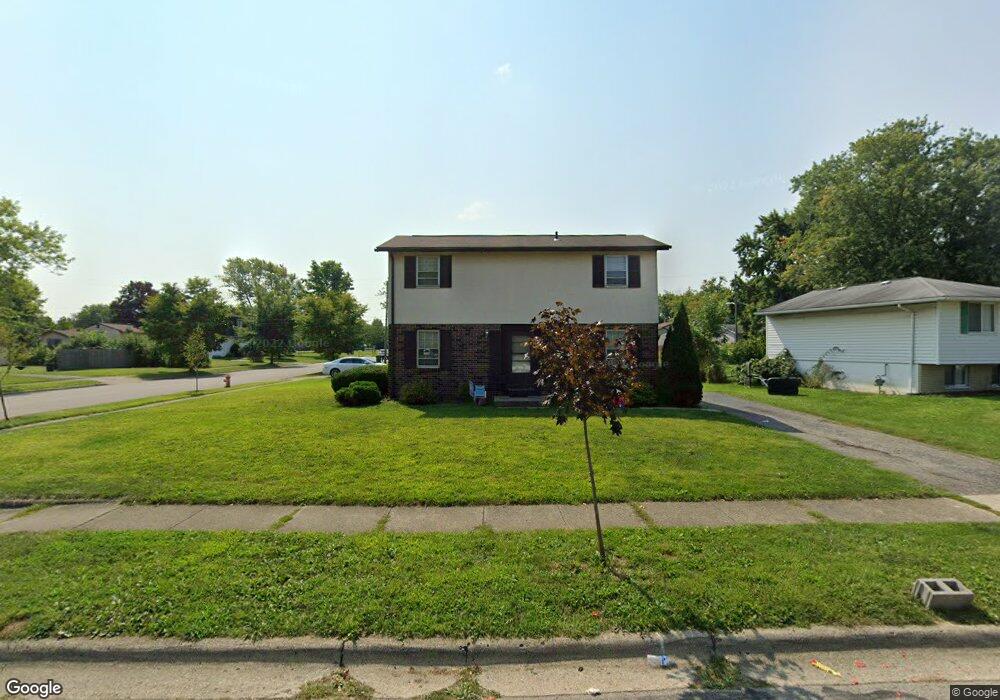
1925 Brimfield Rd Columbus, OH 43229
Forest Park East NeighborhoodEstimated Value: $295,000 - $324,000
5
Beds
3
Baths
1,968
Sq Ft
$157/Sq Ft
Est. Value
About This Home
This home is located at 1925 Brimfield Rd, Columbus, OH 43229 and is currently estimated at $309,176, approximately $157 per square foot. 1925 Brimfield Rd is a home located in Franklin County with nearby schools including Forest Park Elementary School, Woodward Park Middle School, and Northland High School.
Ownership History
Date
Name
Owned For
Owner Type
Purchase Details
Closed on
Jun 20, 2019
Sold by
Habermann Carl P and Habermann Sue A
Bought by
West Michael A
Current Estimated Value
Home Financials for this Owner
Home Financials are based on the most recent Mortgage that was taken out on this home.
Original Mortgage
$120,000
Outstanding Balance
$90,486
Interest Rate
4%
Mortgage Type
New Conventional
Estimated Equity
$218,690
Purchase Details
Closed on
Jan 27, 2006
Sold by
Gornall Leona Mary and Gornall George Wilbur
Bought by
Habermann Carl Philip and Habermann Sue A
Home Financials for this Owner
Home Financials are based on the most recent Mortgage that was taken out on this home.
Original Mortgage
$122,400
Interest Rate
6.34%
Mortgage Type
Fannie Mae Freddie Mac
Purchase Details
Closed on
Feb 18, 1982
Bought by
Gornall Leona M Afdt
Create a Home Valuation Report for This Property
The Home Valuation Report is an in-depth analysis detailing your home's value as well as a comparison with similar homes in the area
Home Values in the Area
Average Home Value in this Area
Purchase History
| Date | Buyer | Sale Price | Title Company |
|---|---|---|---|
| West Michael A | $150,000 | Stewart Ttl Agcy Of Cols Ltd | |
| Habermann Carl Philip | $153,000 | Chicago Tit | |
| Gornall Leona M Afdt | -- | -- |
Source: Public Records
Mortgage History
| Date | Status | Borrower | Loan Amount |
|---|---|---|---|
| Open | West Michael A | $120,000 | |
| Previous Owner | Habermann Carl Philip | $122,400 |
Source: Public Records
Tax History
| Year | Tax Paid | Tax Assessment Tax Assessment Total Assessment is a certain percentage of the fair market value that is determined by local assessors to be the total taxable value of land and additions on the property. | Land | Improvement |
|---|---|---|---|---|
| 2025 | $3,568 | $77,850 | $20,060 | $57,790 |
| 2024 | $3,568 | $77,850 | $20,060 | $57,790 |
| 2023 | $3,523 | $77,840 | $20,055 | $57,785 |
| 2022 | $2,522 | $47,460 | $11,690 | $35,770 |
| 2021 | $2,527 | $47,460 | $11,690 | $35,770 |
| 2020 | $2,530 | $47,460 | $11,690 | $35,770 |
| 2019 | $2,186 | $35,150 | $8,650 | $26,500 |
| 2018 | $2,321 | $35,150 | $8,650 | $26,500 |
| 2017 | $2,443 | $35,150 | $8,650 | $26,500 |
| 2016 | $2,701 | $39,760 | $8,680 | $31,080 |
| 2015 | $2,459 | $39,760 | $8,680 | $31,080 |
| 2014 | $2,465 | $39,760 | $8,680 | $31,080 |
| 2013 | $1,280 | $41,860 | $9,135 | $32,725 |
Source: Public Records
Map
Nearby Homes
- 5726 Beechcroft Rd Unit J
- 5732 Beechcroft Rd Unit B
- 5705 Pine Tree St S Unit G
- 5570 Maple Canyon Ave
- 1752 Pine Tree St S Unit H
- 5762 Pine Tree St W Unit D
- 5485 Tamarack Blvd
- 1687 Brookfield Square S
- 5486 Pine Bluff Rd
- 5458 Sumac Loop S
- 5399 Teakwood Ct
- 5885 Beechcroft Rd Unit 116
- 5396 Teakwood Ct
- 5491 Parkshire Dr Unit 5491
- 5556 Parkshire Dr Unit 5556
- 2208 Pine Knoll Ave
- 2294 Teakwood Dr
- 1638 Arrowood Loop N
- 6035 Karl Rd
- 1451 Chesterton Square S
- 1917 Brimfield Rd
- 1907 Brimfield Rd
- 5615 Beechcroft Rd
- 1945 Brimfield Ct
- 1908 Brookfield Rd
- 1901 Brimfield Rd
- 5651 Beechcroft Rd
- 1922 Brimfield Rd
- 1902 Brookfield Rd
- 5610 Beechcroft Rd
- 1916 Brimfield Rd
- 1953 Brimfield Ct
- 1895 Brimfield Rd
- 5646 Beechcroft Rd Unit 648
- 1908 Brimfield Rd
- 1894 Brookfield Rd
- 1942 Brookfield Rd
- 1902 Brimfield Rd
- 1961 Brimfield Ct
- 1956 Brimfield Ct