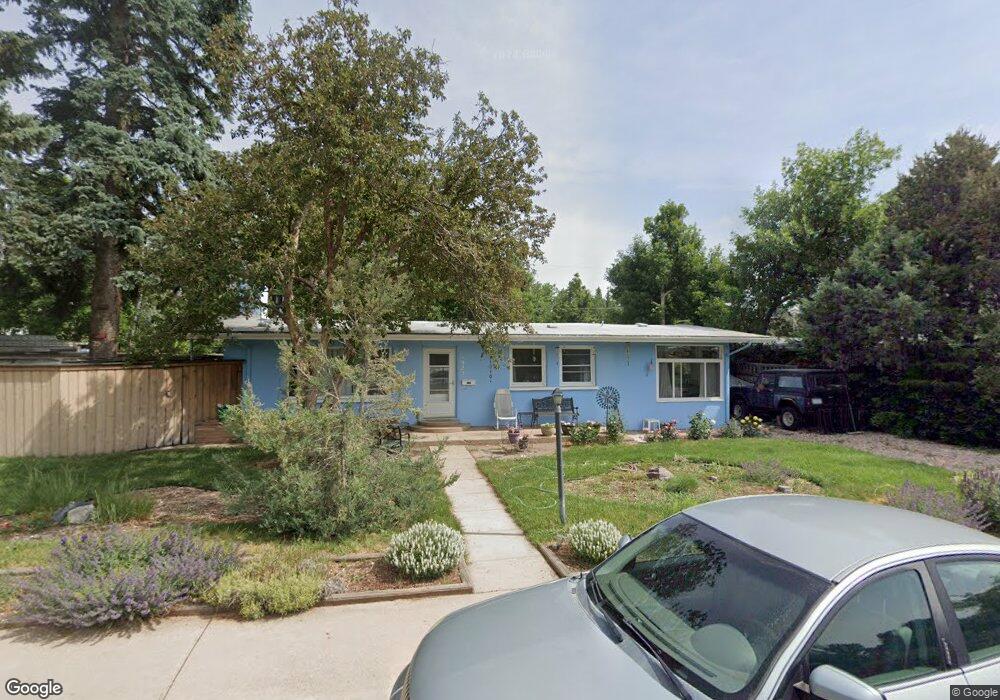
1925 Grape Ave Boulder, CO 80304
Central Boulder NeighborhoodEstimated Value: $894,000 - $1,160,000
3
Beds
1
Bath
1,268
Sq Ft
$811/Sq Ft
Est. Value
About This Home
This home is located at 1925 Grape Ave, Boulder, CO 80304 and is currently estimated at $1,027,732, approximately $810 per square foot. 1925 Grape Ave is a home located in Boulder County with nearby schools including Columbine Elementary School, Casey Middle School, and Boulder High School.
Ownership History
Date
Name
Owned For
Owner Type
Purchase Details
Closed on
Oct 11, 2016
Sold by
Hurbace Henry F and Hurbace Laura J
Bought by
The Hurbace Living Trust
Current Estimated Value
Purchase Details
Closed on
Jan 30, 1975
Bought by
Hurbace Living Trust
Create a Home Valuation Report for This Property
The Home Valuation Report is an in-depth analysis detailing your home's value as well as a comparison with similar homes in the area
Home Values in the Area
Average Home Value in this Area
Purchase History
| Date | Buyer | Sale Price | Title Company |
|---|---|---|---|
| The Hurbace Living Trust | -- | None Available | |
| Hurbace Living Trust | $29,800 | -- |
Source: Public Records
Tax History
| Year | Tax Paid | Tax Assessment Tax Assessment Total Assessment is a certain percentage of the fair market value that is determined by local assessors to be the total taxable value of land and additions on the property. | Land | Improvement |
|---|---|---|---|---|
| 2025 | $5,259 | $63,338 | $57,004 | $6,334 |
| 2024 | $5,259 | $63,338 | $57,004 | $6,334 |
| 2023 | $5,168 | $66,538 | $63,200 | $7,022 |
| 2022 | $4,269 | $52,918 | $47,626 | $5,292 |
| 2021 | $4,070 | $54,440 | $48,996 | $5,444 |
| 2020 | $3,477 | $47,098 | $37,681 | $9,417 |
| 2019 | $3,424 | $47,098 | $37,681 | $9,417 |
| 2018 | $3,066 | $42,566 | $34,056 | $8,510 |
| 2017 | $2,970 | $47,060 | $37,651 | $9,409 |
| 2016 | $2,790 | $40,190 | $32,158 | $8,032 |
| 2015 | $2,642 | $31,721 | $15,761 | $15,960 |
| 2014 | $1,998 | $31,721 | $15,761 | $15,960 |
Source: Public Records
Map
Nearby Homes
Your Personal Tour Guide
Ask me questions while you tour the home.