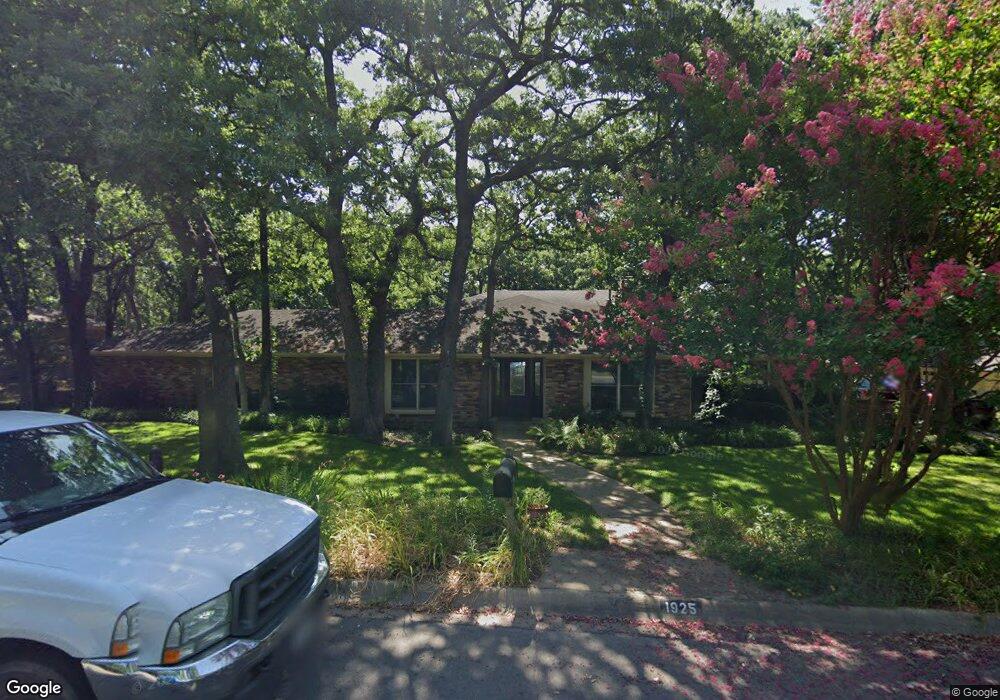
1925 Hollyhill Ln Denton, TX 76205
South Denton NeighborhoodEstimated Value: $434,240 - $545,000
4
Beds
3
Baths
2,657
Sq Ft
$183/Sq Ft
Est. Value
About This Home
This home is located at 1925 Hollyhill Ln, Denton, TX 76205 and is currently estimated at $485,310, approximately $182 per square foot. 1925 Hollyhill Ln is a home located in Denton County with nearby schools including Houston Elementary School, McMath Middle School, and Denton High School.
Ownership History
Date
Name
Owned For
Owner Type
Purchase Details
Closed on
Aug 10, 1998
Sold by
Schindler Margaret Ann and Schindler Margaret A
Bought by
Davis Mark A and Curtis Mary B
Current Estimated Value
Home Financials for this Owner
Home Financials are based on the most recent Mortgage that was taken out on this home.
Original Mortgage
$140,000
Outstanding Balance
$27,643
Interest Rate
6.9%
Estimated Equity
$457,667
Purchase Details
Closed on
Apr 9, 1998
Sold by
Schindler Margaret A and Schindler Van H
Bought by
Schindler Margaret A and Schindler Family Trust
Purchase Details
Closed on
Apr 1, 1996
Sold by
Lewis John Robert
Bought by
Schindler Van H and Schindler Margaret Ann
Home Financials for this Owner
Home Financials are based on the most recent Mortgage that was taken out on this home.
Original Mortgage
$119,000
Interest Rate
7.42%
Create a Home Valuation Report for This Property
The Home Valuation Report is an in-depth analysis detailing your home's value as well as a comparison with similar homes in the area
Home Values in the Area
Average Home Value in this Area
Purchase History
| Date | Buyer | Sale Price | Title Company |
|---|---|---|---|
| Davis Mark A | -- | -- | |
| Schindler Margaret A | -- | -- | |
| Schindler Margaret A | -- | -- | |
| Schindler Van H | -- | -- |
Source: Public Records
Mortgage History
| Date | Status | Borrower | Loan Amount |
|---|---|---|---|
| Open | Davis Mark A | $140,000 | |
| Previous Owner | Schindler Van H | $119,000 |
Source: Public Records
Tax History Compared to Growth
Tax History
| Year | Tax Paid | Tax Assessment Tax Assessment Total Assessment is a certain percentage of the fair market value that is determined by local assessors to be the total taxable value of land and additions on the property. | Land | Improvement |
|---|---|---|---|---|
| 2025 | $3,392 | $324,146 | $113,694 | $210,452 |
| 2024 | $3,392 | $357,027 | $113,694 | $243,333 |
| 2023 | $3,397 | $334,024 | $113,694 | $244,738 |
| 2022 | $6,446 | $303,658 | $100,318 | $237,366 |
| 2021 | $6,137 | $276,053 | $66,879 | $209,174 |
| 2020 | $5,953 | $260,427 | $66,879 | $193,548 |
| 2019 | $6,336 | $265,544 | $66,879 | $198,665 |
| 2018 | $6,154 | $254,753 | $66,879 | $187,874 |
| 2017 | $5,912 | $239,177 | $66,879 | $172,298 |
| 2016 | $5,414 | $219,051 | $66,879 | $152,172 |
| 2015 | $4,431 | $204,240 | $66,879 | $137,361 |
| 2014 | $4,431 | $187,703 | $75,809 | $111,894 |
| 2013 | -- | $193,032 | $75,809 | $117,223 |
Source: Public Records
Map
Nearby Homes
- 2012 Hollyhill Ln
- 2218 Southridge Dr
- 412 Hollyhill Ln Unit 412
- 408 Hollyhill Ln
- 924 Ridgecrest Cir
- 2100 Fairfax Rd
- 2120 Fairfax Rd
- 209 Pennsylvania Dr
- 2226 Savannah Trail
- 2216 Jefferson Trail
- 1412 Ridgecrest Cir
- 1000 Lynhurst Ln
- 829 Skylark Dr
- 2253 Hollyhill Ln
- 2272 Hollyhill Ln
- 821 Sandpiper Dr
- 916 Smokerise Cir
- 824 Sandpiper Dr
- 1012 Indian Ridge Dr
- 1500 Sandy Creek Dr
- 2001 Hollyhill Ln
- 1921 Hollyhill Ln
- 1908 Stonegate Dr
- 1906 Stonegate Dr
- 1910 Stonegate Dr
- 1924 Hollyhill Ln
- 1920 Hollyhill Ln
- 2005 Hollyhill Ln
- 1904 Stonegate Dr
- 1917 Hollyhill Ln
- 2000 Hollyhill Ln
- 1916 Hollyhill Ln
- 1912 Stonegate Dr
- 1905 Stonegate Dr
- 1907 Stonegate Dr
- 2004 Hollyhill Ln
- 2009 Hollyhill Ln
- 1900 Stonegate Dr
- 1912 Hollyhill Ln
- 1903 Stonegate Dr