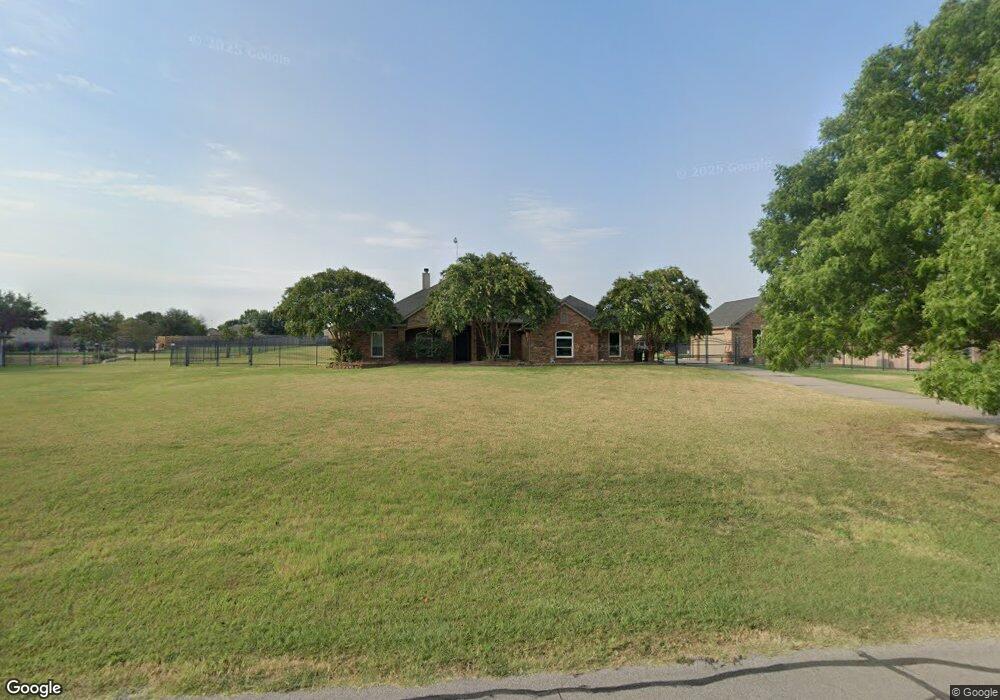
1925 Saw Tooth Ct Haslet, TX 76052
Estimated Value: $607,360 - $646,000
4
Beds
3
Baths
2,608
Sq Ft
$239/Sq Ft
Est. Value
About This Home
This home is located at 1925 Saw Tooth Ct, Haslet, TX 76052 and is currently estimated at $624,090, approximately $239 per square foot. 1925 Saw Tooth Ct is a home located in Tarrant County with nearby schools including Carl E. Schluter Elementary School, Leo Adams Middle School, and V.R. Eaton High School.
Ownership History
Date
Name
Owned For
Owner Type
Purchase Details
Closed on
Feb 20, 2018
Sold by
Paramore Coleman A and Paramore Melody R
Bought by
Hanley Thomas and Hanley Kelly
Current Estimated Value
Home Financials for this Owner
Home Financials are based on the most recent Mortgage that was taken out on this home.
Original Mortgage
$301,600
Outstanding Balance
$255,428
Interest Rate
3.99%
Mortgage Type
New Conventional
Estimated Equity
$368,662
Purchase Details
Closed on
May 2, 2001
Sold by
Sutter Homes Inc
Bought by
Paramore Coleman A and Paramore Melody R
Home Financials for this Owner
Home Financials are based on the most recent Mortgage that was taken out on this home.
Original Mortgage
$123,000
Interest Rate
6.81%
Mortgage Type
Balloon
Purchase Details
Closed on
Jan 1, 1981
Sold by
Lyon Dolores J and Radakovich Steve
Bought by
F C Financial Corp
Create a Home Valuation Report for This Property
The Home Valuation Report is an in-depth analysis detailing your home's value as well as a comparison with similar homes in the area
Home Values in the Area
Average Home Value in this Area
Purchase History
| Date | Buyer | Sale Price | Title Company |
|---|---|---|---|
| Hanley Thomas | -- | None Available | |
| Paramore Coleman A | -- | Alamo Title Company | |
| F C Financial Corp | -- | Commonwealth Land Title |
Source: Public Records
Mortgage History
| Date | Status | Borrower | Loan Amount |
|---|---|---|---|
| Open | Hanley Thomas | $301,600 | |
| Previous Owner | Paramore Coleman A | $123,000 |
Source: Public Records
Tax History
| Year | Tax Paid | Tax Assessment Tax Assessment Total Assessment is a certain percentage of the fair market value that is determined by local assessors to be the total taxable value of land and additions on the property. | Land | Improvement |
|---|---|---|---|---|
| 2025 | $2,431 | $591,736 | $122,316 | $469,420 |
| 2024 | $2,431 | $591,736 | $122,316 | $469,420 |
| 2023 | $7,641 | $581,328 | $75,000 | $506,328 |
| 2022 | $8,067 | $451,187 | $75,000 | $376,187 |
| 2021 | $8,106 | $379,344 | $75,000 | $304,344 |
| 2020 | $7,961 | $380,818 | $75,000 | $305,818 |
| 2019 | $7,994 | $383,414 | $75,000 | $308,414 |
| 2018 | $2,270 | $335,359 | $45,000 | $290,359 |
| 2017 | $7,210 | $333,922 | $45,000 | $288,922 |
| 2016 | $6,956 | $333,496 | $45,000 | $288,496 |
| 2015 | $5,705 | $292,900 | $46,000 | $246,900 |
| 2014 | $5,705 | $292,900 | $46,000 | $246,900 |
Source: Public Records
Map
Nearby Homes
- 11308 Elk Horn Ct
- 1872 Naseby Rd
- 1820 Walpole Way
- 11325 Elk Horn Ct
- 11153 Abbotsbury Rd
- 11109 Carham St
- 1849 Walpole Way
- 11125 Carham St
- 11540 Ely Place
- 11149 Carham St
- 11429 Jackloe St
- 11417 Jackloe St
- 11512 Wulstone Rd
- 11413 Jackloe St
- 11148 Carham St
- 1808 Roslin Rd
- 1764 Mayton Ave
- 11528 Wulstone Rd
- 11313 Bratton Blvd
- 11548 Ely Place
- 1937 Saw Tooth Ct
- 1913 Saw Tooth Ct
- 1924 Saw Tooth Ct
- 1936 Saw Tooth Ct
- 1949 Saw Tooth Ct
- 1912 Saw Tooth Ct
- 1948 Saw Tooth Ct
- 1924 White Cloud Ct
- 1901 Saw Tooth Ct Unit 156
- 1901 Saw Tooth Ct
- 1912 White Cloud Ct
- 1900 Saw Tooth Ct
- 1936 White Cloud Ct
- 1900 White Cloud Ct
- 11000 Blue Sky Dr
- 1948 White Cloud Ct
- 1949 White Cloud Ct
- 10980 Blue Sky Dr
- 11101 Blue Sky Dr
- 1901 White Cloud Ct
Your Personal Tour Guide
Ask me questions while you tour the home.