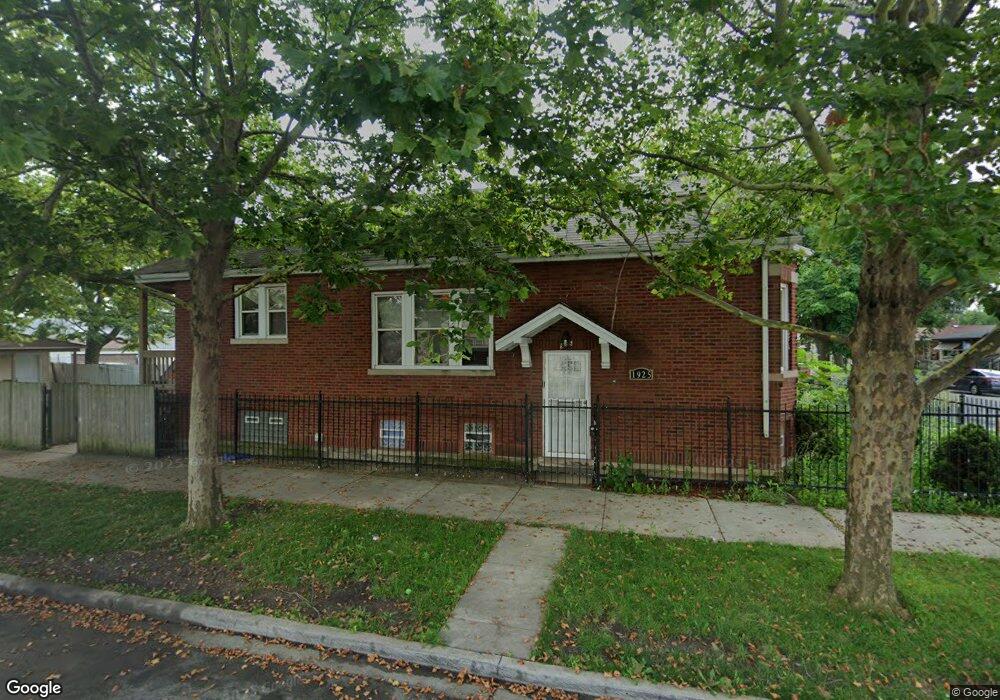
1925 W 73rd St Chicago, IL 60636
Englewood NeighborhoodEstimated Value: $134,000 - $192,000
3
Beds
1
Bath
1,180
Sq Ft
$142/Sq Ft
Est. Value
About This Home
This home is located at 1925 W 73rd St, Chicago, IL 60636 and is currently estimated at $167,829, approximately $142 per square foot. 1925 W 73rd St is a home located in Cook County with nearby schools including Randolph Elementary School and The Montessori School of Englewood Charter School.
Ownership History
Date
Name
Owned For
Owner Type
Purchase Details
Closed on
Feb 20, 2007
Sold by
Wells Fargo Bank Na
Bought by
Mcknight Marlon
Current Estimated Value
Home Financials for this Owner
Home Financials are based on the most recent Mortgage that was taken out on this home.
Original Mortgage
$110,750
Interest Rate
6.2%
Mortgage Type
Construction
Purchase Details
Closed on
Feb 12, 2007
Sold by
Va
Bought by
Wells Fargo Bank Na
Home Financials for this Owner
Home Financials are based on the most recent Mortgage that was taken out on this home.
Original Mortgage
$110,750
Interest Rate
6.2%
Mortgage Type
Construction
Purchase Details
Closed on
Oct 2, 2006
Sold by
Coleman Kenneth E
Bought by
Va
Purchase Details
Closed on
Sep 3, 1997
Sold by
Engelbrecht Kevin
Bought by
Coleman Kenneth E
Home Financials for this Owner
Home Financials are based on the most recent Mortgage that was taken out on this home.
Original Mortgage
$54,950
Interest Rate
7.44%
Mortgage Type
VA
Create a Home Valuation Report for This Property
The Home Valuation Report is an in-depth analysis detailing your home's value as well as a comparison with similar homes in the area
Home Values in the Area
Average Home Value in this Area
Purchase History
| Date | Buyer | Sale Price | Title Company |
|---|---|---|---|
| Mcknight Marlon | $84,000 | First American Title | |
| Wells Fargo Bank Na | -- | First American Title Co | |
| Va | -- | None Available | |
| Coleman Kenneth E | $36,000 | -- |
Source: Public Records
Mortgage History
| Date | Status | Borrower | Loan Amount |
|---|---|---|---|
| Previous Owner | Mcknight Marlon | $110,750 | |
| Previous Owner | Coleman Kenneth E | $54,950 |
Source: Public Records
Tax History Compared to Growth
Tax History
| Year | Tax Paid | Tax Assessment Tax Assessment Total Assessment is a certain percentage of the fair market value that is determined by local assessors to be the total taxable value of land and additions on the property. | Land | Improvement |
|---|---|---|---|---|
| 2025 | $777 | $9,001 | $938 | $8,063 |
| 2024 | $777 | $9,001 | $938 | $8,063 |
| 2023 | $736 | $7,000 | $2,031 | $4,969 |
| 2022 | $736 | $7,000 | $2,031 | $4,969 |
| 2021 | $738 | $6,999 | $2,031 | $4,968 |
| 2020 | $756 | $6,494 | $2,031 | $4,463 |
| 2019 | $761 | $7,216 | $2,031 | $5,185 |
| 2018 | $747 | $7,216 | $2,031 | $5,185 |
| 2017 | $1,126 | $8,605 | $1,875 | $6,730 |
| 2016 | $1,223 | $8,605 | $1,875 | $6,730 |
| 2015 | $1,096 | $8,605 | $1,875 | $6,730 |
| 2014 | $825 | $7,013 | $1,718 | $5,295 |
| 2013 | $797 | $7,013 | $1,718 | $5,295 |
Source: Public Records
Map
Nearby Homes
- 7332 S Honore St
- 7159 S Winchester Ave
- 7252 S Wood St
- 7349 S Honore St
- 7246 S Wood St
- 7330 S Wood St
- 7142 S Damen Ave
- 7219 S Wood St
- 7228 S Hermitage Ave
- 7149 S Wood St
- 7130 S Seeley Ave
- 1851 W 71st St
- 7511 S Damen Ave
- 1809 W 71st St
- 7244 S Paulina St
- 7056 S Honore St
- 7049 S Damen Ave
- 7540 S Winchester Ave
- 7028 S Honore St
- 7557 S Winchester Ave
- 7303 S Winchester Ave
- 7307 S Winchester Ave
- 7309 S Winchester Ave
- 7259 S Winchester Ave
- 7311 S Winchester Ave
- 7257 S Winchester Ave
- 7315 S Winchester Ave
- 7302 S Wolcott Ave
- 7317 S Winchester Ave
- 7306 S Wolcott Ave
- 7251 S Winchester Ave Unit 1
- 7251 S Winchester Ave Unit 2
- 7251 S Winchester Ave
- 7310 S Wolcott Ave
- 7258 S Wolcott Ave
- 7319 S Winchester Ave
- 7254 S Wolcott Ave
- 7312 S Wolcott Ave
- 7249 S Winchester Ave
- 7300 S Winchester Ave