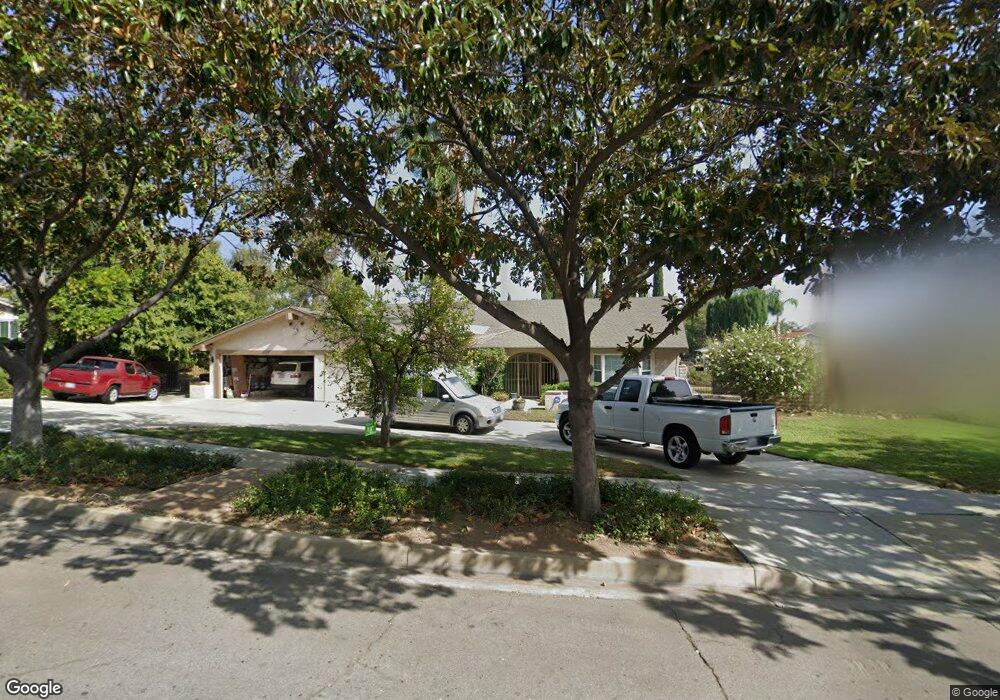
1926 N Quince Way Upland, CA 91784
Estimated Value: $1,059,477 - $1,267,000
4
Beds
3
Baths
2,553
Sq Ft
$444/Sq Ft
Est. Value
About This Home
This home is located at 1926 N Quince Way, Upland, CA 91784 and is currently estimated at $1,134,369, approximately $444 per square foot. 1926 N Quince Way is a home located in San Bernardino County with nearby schools including Magnolia Elementary, Pioneer Junior High School, and Upland High School.
Ownership History
Date
Name
Owned For
Owner Type
Purchase Details
Closed on
Apr 5, 2022
Sold by
Kay Barnes and Kay Myrna
Bought by
Barnes Family Trust
Current Estimated Value
Purchase Details
Closed on
Aug 1, 2013
Sold by
Barnes Myrna Kay
Bought by
Barnes Abraham and Barnes Myrna Kay
Home Financials for this Owner
Home Financials are based on the most recent Mortgage that was taken out on this home.
Original Mortgage
$82,500
Interest Rate
4.46%
Mortgage Type
New Conventional
Purchase Details
Closed on
Nov 22, 2001
Sold by
Barnes Family Trust
Bought by
Myrna Kay Tucker Barnes Trust
Purchase Details
Closed on
Nov 8, 1993
Sold by
Barnes Myrna Kay and Ysasi Myrna Kay
Bought by
Barnes Abraham and Barnes Myrna Kay
Create a Home Valuation Report for This Property
The Home Valuation Report is an in-depth analysis detailing your home's value as well as a comparison with similar homes in the area
Home Values in the Area
Average Home Value in this Area
Purchase History
| Date | Buyer | Sale Price | Title Company |
|---|---|---|---|
| Barnes Family Trust | -- | None Listed On Document | |
| Barnes Abraham | -- | First American Title Company | |
| Myrna Kay Tucker Barnes Trust | -- | None Listed On Document | |
| Barnes Myrna Kay | -- | -- | |
| Barnes Abraham | -- | -- |
Source: Public Records
Mortgage History
| Date | Status | Borrower | Loan Amount |
|---|---|---|---|
| Previous Owner | Barnes Abraham | $82,500 |
Source: Public Records
Tax History Compared to Growth
Tax History
| Year | Tax Paid | Tax Assessment Tax Assessment Total Assessment is a certain percentage of the fair market value that is determined by local assessors to be the total taxable value of land and additions on the property. | Land | Improvement |
|---|---|---|---|---|
| 2025 | $3,066 | $275,835 | $49,814 | $226,021 |
| 2024 | $3,066 | $270,426 | $48,837 | $221,589 |
| 2023 | $3,019 | $265,123 | $47,879 | $217,244 |
| 2022 | $2,879 | $259,924 | $46,940 | $212,984 |
| 2021 | $2,872 | $254,828 | $46,020 | $208,808 |
| 2020 | $2,793 | $252,215 | $45,548 | $206,667 |
| 2019 | $2,783 | $247,270 | $44,655 | $202,615 |
| 2018 | $2,716 | $242,421 | $43,779 | $198,642 |
| 2017 | $2,636 | $237,668 | $42,921 | $194,747 |
| 2016 | $2,445 | $233,007 | $42,079 | $190,928 |
| 2015 | $2,388 | $229,507 | $41,447 | $188,060 |
| 2014 | $2,325 | $225,011 | $40,635 | $184,376 |
Source: Public Records
Map
Nearby Homes
- 1931 N Redding Way
- 256 W 18th St
- 1844 N 1st Ave
- 1817 N Vallejo Way
- 322 E 19th St
- 1754 N Tulare Way
- 666 W 21st St
- 1817 Balboa Way
- 211 Deborah Ct
- 1788 N Coolcrest Ave
- 2162 N Euclid Ave
- 785 W Dalton Ct
- 1629 N Palm Ave
- 882 W 17th St
- 1604 N Laurel Ave
- 1623 N Vallejo Way
- 2241 N 1st Ave
- 860 Emerson St
- 1243 Jacaranda Place
- 1146 Oneil St
- 1931 N Palm Way
- 1918 N Quince Way
- 1917 N Palm Way
- 1937 N Palm Way
- 1929 N Quince Way
- 1942 N Quince Way
- 1906 N Quince Way
- 1937 N Quince Way
- 1905 N Palm Way
- 1942 N Palm Way
- 1905 N Quince Way
- 1926 N Palm Way
- 1934 N Redding Way
- 1926 N Redding Way
- 1916 N Palm Way
- 1916 N Palm Way
- 1938 N Palm Way
- 1942 N Redding Way
- 415 W 19th St
- 1904 N Palm Way