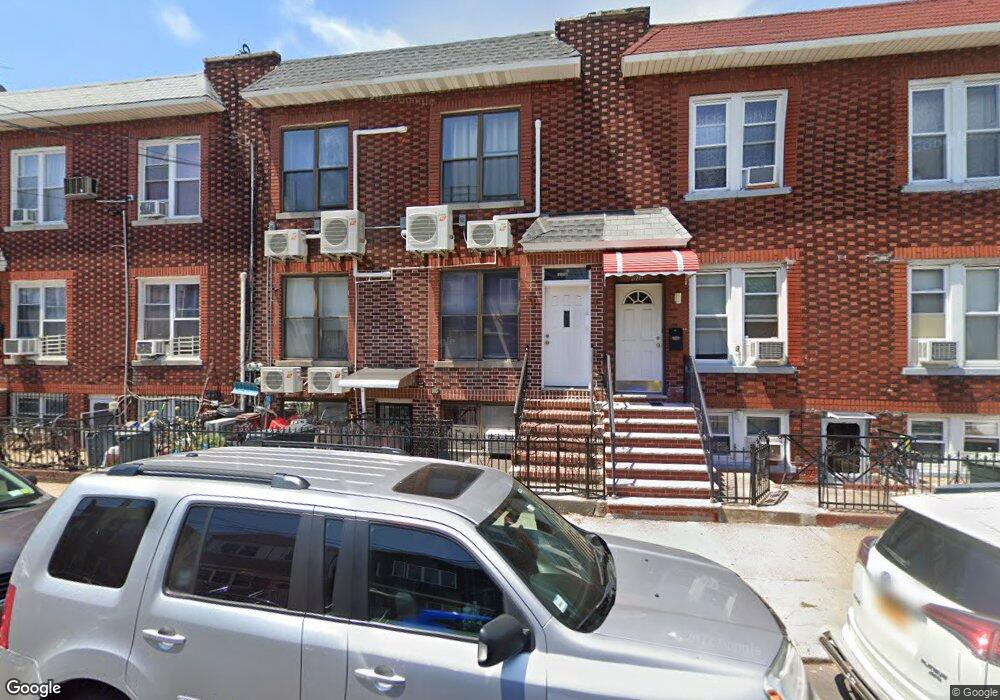
1926 W 7th St Brooklyn, NY 11223
Gravesend NeighborhoodEstimated Value: $1,309,000 - $1,954,000
Studio
--
Bath
2,431
Sq Ft
$641/Sq Ft
Est. Value
About This Home
This home is located at 1926 W 7th St, Brooklyn, NY 11223 and is currently estimated at $1,558,667, approximately $641 per square foot. 1926 W 7th St is a home located in Kings County with nearby schools including P.S. 97 - The Highlawn, Is 228 David A Boody, and Coney Island Preparatory Public Charter School.
Ownership History
Date
Name
Owned For
Owner Type
Purchase Details
Closed on
May 11, 2022
Sold by
Li Xuan Jiang and Lu Jia Luan
Bought by
Li Xuan Jiang
Current Estimated Value
Purchase Details
Closed on
Apr 5, 2018
Sold by
Lu Jia Luan
Bought by
Li Xuan Jiang and Lu Jia Luan
Purchase Details
Closed on
Mar 5, 2010
Sold by
Chen Qing Yi and Li Chun Mei
Bought by
Lu Jia Luan
Home Financials for this Owner
Home Financials are based on the most recent Mortgage that was taken out on this home.
Original Mortgage
$938,250
Interest Rate
5.05%
Mortgage Type
Reverse Mortgage Home Equity Conversion Mortgage
Create a Home Valuation Report for This Property
The Home Valuation Report is an in-depth analysis detailing your home's value as well as a comparison with similar homes in the area
Home Values in the Area
Average Home Value in this Area
Purchase History
| Date | Buyer | Sale Price | Title Company |
|---|---|---|---|
| Li Xuan Jiang | -- | -- | |
| Li Xuan Jiang | -- | -- | |
| Lu Jia Luan | -- | -- |
Source: Public Records
Mortgage History
| Date | Status | Borrower | Loan Amount |
|---|---|---|---|
| Previous Owner | Lu Jia Luan | $938,250 |
Source: Public Records
Tax History
| Year | Tax Paid | Tax Assessment Tax Assessment Total Assessment is a certain percentage of the fair market value that is determined by local assessors to be the total taxable value of land and additions on the property. | Land | Improvement |
|---|---|---|---|---|
| 2025 | $7,513 | $99,840 | $9,300 | $90,540 |
| 2024 | $7,513 | $78,840 | $9,300 | $69,540 |
| 2023 | $7,247 | $92,160 | $9,300 | $82,860 |
| 2022 | $3,725 | $88,440 | $9,300 | $79,140 |
| 2021 | $6,786 | $83,220 | $9,300 | $73,920 |
| 2020 | $3,373 | $65,520 | $9,300 | $56,220 |
| 2019 | $6,520 | $65,520 | $9,300 | $56,220 |
| 2018 | $6,062 | $29,738 | $4,198 | $25,540 |
| 2017 | $5,770 | $28,305 | $4,155 | $24,150 |
| 2016 | $5,372 | $26,872 | $4,513 | $22,359 |
| 2015 | $3,001 | $26,872 | $6,106 | $20,766 |
| 2014 | $3,001 | $25,975 | $7,080 | $18,895 |
Source: Public Records
Map
Nearby Homes
Your Personal Tour Guide
Ask me questions while you tour the home.