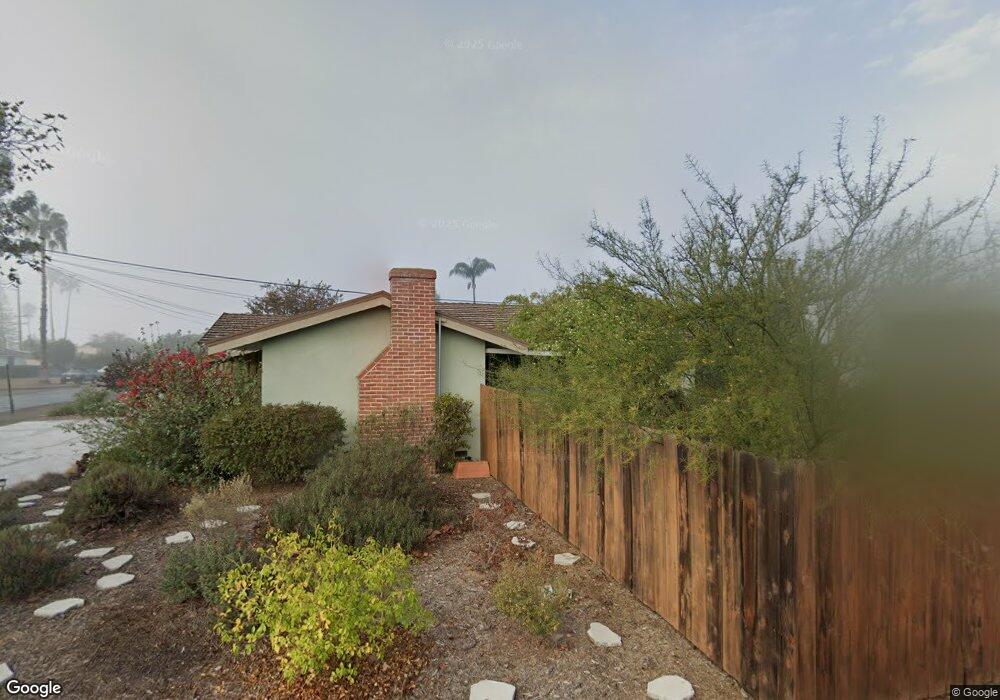
1926 Wedgemere Rd El Cajon, CA 92020
Fletcher Hills NeighborhoodEstimated Value: $812,860 - $958,000
3
Beds
2
Baths
1,397
Sq Ft
$641/Sq Ft
Est. Value
About This Home
This home is located at 1926 Wedgemere Rd, El Cajon, CA 92020 and is currently estimated at $895,965, approximately $641 per square foot. 1926 Wedgemere Rd is a home located in San Diego County with nearby schools including Northmont Elementary School, Parkway Academy, and Grossmont High School.
Ownership History
Date
Name
Owned For
Owner Type
Purchase Details
Closed on
Feb 23, 2013
Sold by
Mann Amy Elizabeth and Mann Bryan Wesley
Bought by
Mann Bryan Wesley and Mann Amy Elizabeth
Current Estimated Value
Home Financials for this Owner
Home Financials are based on the most recent Mortgage that was taken out on this home.
Original Mortgage
$218,625
Outstanding Balance
$42,794
Interest Rate
2.68%
Mortgage Type
New Conventional
Estimated Equity
$853,171
Purchase Details
Closed on
Nov 2, 2010
Sold by
Fitzsimons Robert Alan
Bought by
Roberts Amy Elizabeth and Mann Bryan Wesley
Home Financials for this Owner
Home Financials are based on the most recent Mortgage that was taken out on this home.
Original Mortgage
$255,000
Interest Rate
4.18%
Mortgage Type
New Conventional
Purchase Details
Closed on
Apr 22, 2000
Sold by
Fitzsimons Willet Eugene and Fitzsimons Sue Marie
Bought by
Fitzsimons Willet Eugene and Fitzsimons Sue Marie
Create a Home Valuation Report for This Property
The Home Valuation Report is an in-depth analysis detailing your home's value as well as a comparison with similar homes in the area
Home Values in the Area
Average Home Value in this Area
Purchase History
| Date | Buyer | Sale Price | Title Company |
|---|---|---|---|
| Mann Bryan Wesley | -- | Servicelink | |
| Roberts Amy Elizabeth | $340,000 | First American Title Company | |
| Fitzsimons Willet Eugene | -- | -- |
Source: Public Records
Mortgage History
| Date | Status | Borrower | Loan Amount |
|---|---|---|---|
| Open | Mann Bryan Wesley | $218,625 | |
| Closed | Roberts Amy Elizabeth | $255,000 |
Source: Public Records
Tax History Compared to Growth
Tax History
| Year | Tax Paid | Tax Assessment Tax Assessment Total Assessment is a certain percentage of the fair market value that is determined by local assessors to be the total taxable value of land and additions on the property. | Land | Improvement |
|---|---|---|---|---|
| 2025 | $5,490 | $435,591 | $204,984 | $230,607 |
| 2024 | $5,490 | $427,051 | $200,965 | $226,086 |
| 2023 | $5,327 | $418,678 | $197,025 | $221,653 |
| 2022 | $5,281 | $410,469 | $193,162 | $217,307 |
| 2021 | $5,136 | $402,422 | $189,375 | $213,047 |
| 2020 | $4,949 | $398,297 | $187,434 | $210,863 |
| 2019 | $4,481 | $390,488 | $183,759 | $206,729 |
| 2018 | $4,386 | $382,832 | $180,156 | $202,676 |
| 2017 | $4,322 | $375,326 | $176,624 | $198,702 |
| 2016 | $4,180 | $367,967 | $173,161 | $194,806 |
| 2015 | $4,150 | $362,440 | $170,560 | $191,880 |
| 2014 | $4,065 | $355,341 | $167,219 | $188,122 |
Source: Public Records
Map
Nearby Homes
- 198 Croydon Ln
- 275 Hihill Way
- 1681 Hillsmont Dr
- 1673 Hillsmont Dr
- 2213 Chatham St
- 9348 Horton Dr
- 2394 Dryden Rd
- 282 Garfield Ave
- 6130 Howell Dr
- 1958 Milford Place
- 302 Travelodge Dr
- 1280 W Main St Unit 3
- 1280 W Main St Unit 24
- 1280 W Main St Unit 6
- 370 N Cuyamaca St
- 346 El Monte Rd
- 168 S Pierce St
- 700 Wakefield Ct
- 5750 Amaya Dr Unit 10
- 1387 Weers St
- 1938 Wedgemere Rd
- 1904 Wedgemere Rd
- 183 Croydon Ln
- 1956 Wedgemere Rd
- 1927 Wedgemere Rd
- 215 Croydon Ln
- 1915 Wedgemere Rd
- 1982 Wedgemere Rd
- 176 Croydon Ln
- 1886 Wedgemere Rd
- 1899 Wedgemere Rd
- 162 Croydon Ln
- 229 Croydon Ln
- 150 Croydon Ln
- 6405 Kimi Ln
- 000 Tyrone St
- 216 Croydon Ln
- 1989 Wedgemere Rd
- 1883 Wedgemere Rd
- 1878 Wedgemere Rd