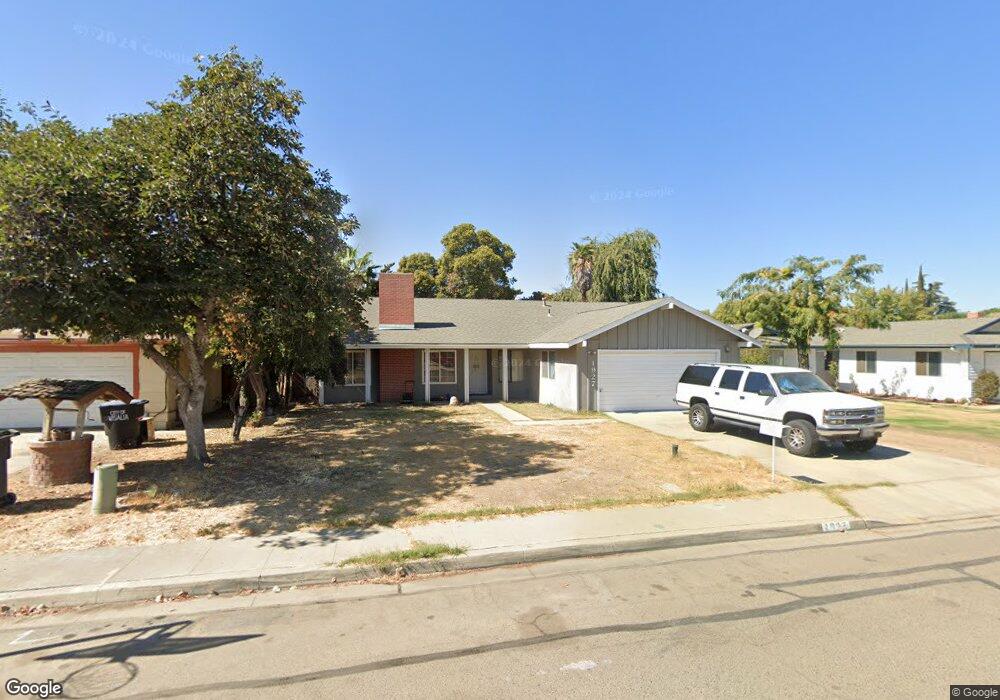
1927 S Bollinger St Visalia, CA 93277
Estimated Value: $304,011 - $351,000
3
Beds
3
Baths
1,430
Sq Ft
$230/Sq Ft
Est. Value
About This Home
This home is located at 1927 S Bollinger St, Visalia, CA 93277 and is currently estimated at $329,503, approximately $230 per square foot. 1927 S Bollinger St is a home located in Tulare County with nearby schools including Veva Blunt Elementary School, La Joya Middle School, and El Diamante High School.
Ownership History
Date
Name
Owned For
Owner Type
Purchase Details
Closed on
Apr 12, 2006
Sold by
Marroquin Abraham
Bought by
Marroquin Angel Cesar
Current Estimated Value
Purchase Details
Closed on
May 20, 1997
Sold by
Hud
Bought by
Marroquin Abraham and Marroquin Elvia
Home Financials for this Owner
Home Financials are based on the most recent Mortgage that was taken out on this home.
Original Mortgage
$57,733
Outstanding Balance
$7,962
Interest Rate
8.08%
Mortgage Type
Purchase Money Mortgage
Estimated Equity
$321,541
Purchase Details
Closed on
Aug 12, 1996
Sold by
Burger Randy L
Bought by
Source One Mtg Services Corp
Purchase Details
Closed on
Oct 7, 1993
Sold by
Burger Randy L
Bought by
Becerra Edward and Becerra Rose A
Home Financials for this Owner
Home Financials are based on the most recent Mortgage that was taken out on this home.
Original Mortgage
$12,000
Interest Rate
6.91%
Mortgage Type
Purchase Money Mortgage
Create a Home Valuation Report for This Property
The Home Valuation Report is an in-depth analysis detailing your home's value as well as a comparison with similar homes in the area
Home Values in the Area
Average Home Value in this Area
Purchase History
| Date | Buyer | Sale Price | Title Company |
|---|---|---|---|
| Marroquin Angel Cesar | -- | None Available | |
| Marroquin Abraham | $72,167 | North American Title Co | |
| Source One Mtg Services Corp | $83,673 | First American Title Ins Co | |
| Becerra Edward | -- | Fidelity National Title |
Source: Public Records
Mortgage History
| Date | Status | Borrower | Loan Amount |
|---|---|---|---|
| Open | Marroquin Abraham | $57,733 | |
| Previous Owner | Becerra Edward | $12,000 | |
| Closed | Becerra Edward | $14,300 |
Source: Public Records
Tax History Compared to Growth
Tax History
| Year | Tax Paid | Tax Assessment Tax Assessment Total Assessment is a certain percentage of the fair market value that is determined by local assessors to be the total taxable value of land and additions on the property. | Land | Improvement |
|---|---|---|---|---|
| 2025 | $1,346 | $127,034 | $48,859 | $78,175 |
| 2024 | $1,346 | $124,544 | $47,901 | $76,643 |
| 2023 | $1,309 | $122,103 | $46,962 | $75,141 |
| 2022 | $1,251 | $119,710 | $46,042 | $73,668 |
| 2021 | $1,252 | $117,363 | $45,139 | $72,224 |
| 2020 | $1,237 | $116,159 | $44,676 | $71,483 |
| 2019 | $1,207 | $113,881 | $43,800 | $70,081 |
| 2018 | $1,171 | $111,648 | $42,941 | $68,707 |
| 2017 | $1,164 | $109,459 | $42,099 | $67,360 |
| 2016 | $1,137 | $107,313 | $41,274 | $66,039 |
| 2015 | $1,105 | $105,701 | $40,654 | $65,047 |
| 2014 | $1,105 | $103,631 | $39,858 | $63,773 |
Source: Public Records
Map
Nearby Homes
- 1633 S Chinowth St
- 4239 W Mary Ave
- 4615 W Feemster Ave
- 4438 W Feemster Ave
- 3924 W Fairhaven Ave
- 4614 W Howard Ave
- 4746 W Ashland Ave
- 4633 W Cherry Ave
- 3804 W Judy Ave
- 4024 W Howard Ave
- 4737 W Iris Ave
- 4747 W Iris Ave
- 4523 W Evergreen Ct
- 5125 W Feemster Ct
- 1233 S Kent St
- 4847 W Iris Ave
- 3708 W Paradise Ave
- 1937 S Royal Oaks Dr
- 3504 W Cutler Ave
- 924 S Jennie St
- 1917 S Bollinger St
- 1937 S Bollinger St
- 1928 S Linwood St
- 1918 S Linwood St
- 1938 S Linwood St
- 1907 S Bollinger St
- 1928 S Bollinger St
- 1908 S Linwood St
- 1918 S Bollinger St
- 1938 S Bollinger St
- 1849 S Bollinger St
- 1908 S Bollinger St
- 1850 S Linwood St
- 1927 S Cindy Ct
- 1850 S Bollinger St
- 1839 S Bollinger St
- 1917 S Cindy Ct
- 1840 S Linwood St
- 4339 W Walnut Ave
- 4337 W Walnut Ave