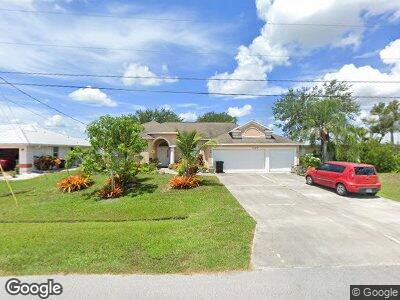
1927 SE Dranson Cir Port Saint Lucie, FL 34952
Sandhill Crossing NeighborhoodEstimated Value: $472,832 - $622,000
4
Beds
3
Baths
2,381
Sq Ft
$228/Sq Ft
Est. Value
About This Home
This home is located at 1927 SE Dranson Cir, Port Saint Lucie, FL 34952 and is currently estimated at $543,708, approximately $228 per square foot. 1927 SE Dranson Cir is a home located in St. Lucie County with nearby schools including Mariposa Elementary School, Morningside Elementary School, and Floresta Elementary School.
Ownership History
Date
Name
Owned For
Owner Type
Purchase Details
Closed on
Feb 4, 2010
Sold by
Aurora Loan Servicing Corp
Bought by
Larsen Neal
Current Estimated Value
Purchase Details
Closed on
Nov 18, 2009
Sold by
Palloo Sieukaran
Bought by
Aurora Loan Servicing Corporation
Purchase Details
Closed on
Aug 17, 2006
Sold by
Mercedes Homes Inc
Bought by
Palloo Sieukaran
Home Financials for this Owner
Home Financials are based on the most recent Mortgage that was taken out on this home.
Original Mortgage
$272,000
Interest Rate
6.27%
Mortgage Type
Purchase Money Mortgage
Purchase Details
Closed on
Feb 18, 2005
Sold by
Beach Development Coro Of The Treasure C
Bought by
Mercedes Homes Inc
Purchase Details
Closed on
Mar 25, 1998
Sold by
Passalacqua Thomas and Passalacqua Elaine
Bought by
Latchum Elizabeth M
Create a Home Valuation Report for This Property
The Home Valuation Report is an in-depth analysis detailing your home's value as well as a comparison with similar homes in the area
Home Values in the Area
Average Home Value in this Area
Purchase History
| Date | Buyer | Sale Price | Title Company |
|---|---|---|---|
| Larsen Neal | $165,000 | Title Svcs The Palm Beaches | |
| Aurora Loan Servicing Corporation | $82,500 | Attorney | |
| Palloo Sieukaran | $340,000 | Ocean Title & Escrow Company | |
| Mercedes Homes Inc | $78,500 | -- | |
| Beach Development Corp Of The Treasure C | $74,000 | -- | |
| Latchum Elizabeth M | $7,500 | -- |
Source: Public Records
Mortgage History
| Date | Status | Borrower | Loan Amount |
|---|---|---|---|
| Previous Owner | Palloo Sieukaran | $272,000 |
Source: Public Records
Tax History Compared to Growth
Tax History
| Year | Tax Paid | Tax Assessment Tax Assessment Total Assessment is a certain percentage of the fair market value that is determined by local assessors to be the total taxable value of land and additions on the property. | Land | Improvement |
|---|---|---|---|---|
| 2024 | $5,512 | $266,257 | -- | -- |
| 2023 | $5,512 | $258,502 | $0 | $0 |
| 2022 | $5,332 | $250,973 | $0 | $0 |
| 2021 | $5,280 | $243,664 | $0 | $0 |
| 2020 | $5,326 | $240,300 | $56,000 | $184,300 |
| 2019 | $5,416 | $240,100 | $52,000 | $188,100 |
| 2018 | $5,625 | $224,800 | $40,000 | $184,800 |
| 2017 | $5,258 | $209,600 | $34,000 | $175,600 |
| 2016 | $4,830 | $184,300 | $25,600 | $158,700 |
| 2015 | $4,420 | $154,500 | $20,000 | $134,500 |
| 2014 | $3,885 | $141,200 | $0 | $0 |
Source: Public Records
Map
Nearby Homes
- 1902 SE Dranson Cir
- 1950 SE Dranson Cir
- 1861 SE Dranson Cir
- 2500 SE Sapelo Ave
- 1998 SE Lavina Cir
- 1992 SE Bowie St
- 1833 SE Bowie St
- 2302 SE Melaleuca Blvd
- 1834 SE Bowie St
- 2707 SE Rawlings Rd
- 2501 SE Melaleuca Blvd
- 2461 SE Alfonso Ave
- 1824 SE Gaskins Cir
- 1991 SE Dock St
- 1749 SE Berkshire Blvd
- 2733 SE Garfield Ave
- 2241 SE Bowie St
- 2122 SE Heathwood Cir
- 2433 SE Renick Ave
- 1771 SE Gaskins Cir
- 1927 SE Dranson Cir
- 1921 SE Dranson Cir
- 1933 SE Dranson Cir
- 1932 SE Dranson Cir
- 1938 SE Dranson Cir
- 1926 SE Dranson Cir
- 1939 SE Dranson Cir
- 1920 SE Dranson Cir
- 1919 SE Bowie St
- 1913 SE Bowie St
- 0 SE Dranson Cir
- 1938 SE Lavina Cir
- 1907 SE Bowie St
- 1914 SE Dranson Cir
- 1931 SE Bowie St
- 1944 SE Lavina Cir
- 1905 SE Dranson Cir
- 1932 SE Lavina Cir
- 1946 SE Dranson Cir
- 1937 SE Bowie St