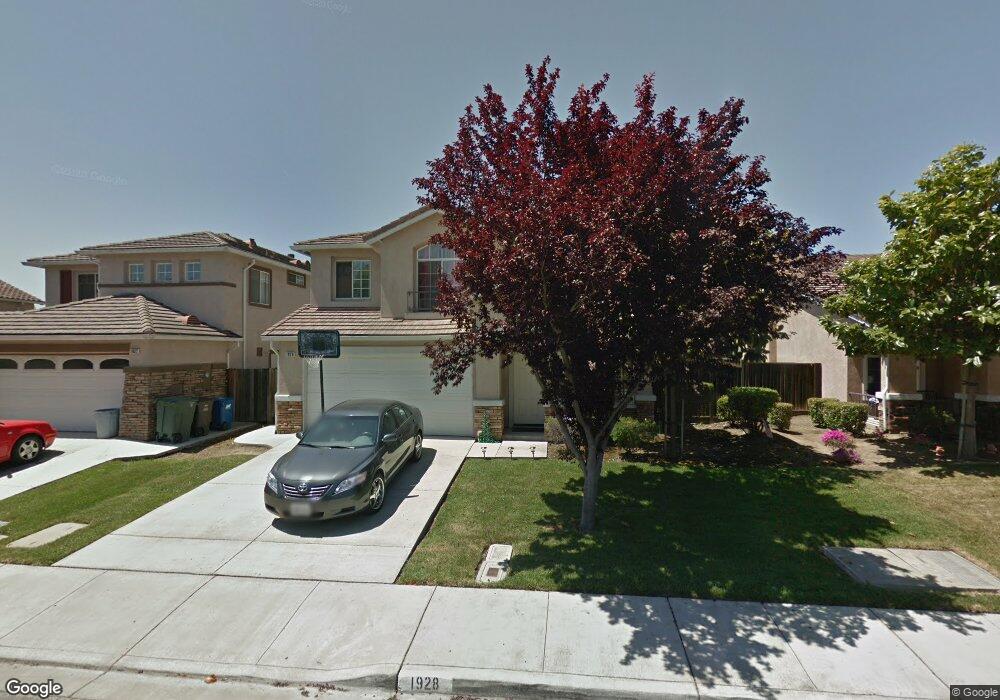
1928 Abreu Way Union City, CA 94587
Estimated Value: $1,031,000 - $1,763,000
--
Bed
--
Bath
--
Sq Ft
4,617
Sq Ft Lot
About This Home
This home is located at 1928 Abreu Way, Union City, CA 94587 and is currently estimated at $1,442,797. 1928 Abreu Way is a home located in Alameda County with nearby schools including Tom Kitayama Elementary School, Cesar Chavez Middle School, and James Logan High School.
Ownership History
Date
Name
Owned For
Owner Type
Purchase Details
Closed on
Mar 8, 2018
Sold by
Lee David Don
Bought by
Lee David Don and Lee Iok Kam
Current Estimated Value
Purchase Details
Closed on
Aug 11, 2017
Sold by
Lee David Don and The Chang Teal Yat Lee Survivo
Bought by
Lee David Don
Purchase Details
Closed on
May 28, 2008
Sold by
Lee Chang Teal Yat and Don Lee & Chang Teal Yat Lee 1
Bought by
Lee Chang Teal Yat and Chang Teal Yat Lee Survivors T
Purchase Details
Closed on
Aug 28, 2003
Sold by
Lee Don and Lee Chang Teal Yat
Bought by
Lee Don and Lee Chang Teal Yat
Purchase Details
Closed on
Dec 9, 1998
Sold by
Kaufman & Broad South Bay Inc
Bought by
Teal Lee Don and Teal Lee Yat
Home Financials for this Owner
Home Financials are based on the most recent Mortgage that was taken out on this home.
Original Mortgage
$283,505
Outstanding Balance
$64,843
Interest Rate
6.86%
Estimated Equity
$1,377,954
Create a Home Valuation Report for This Property
The Home Valuation Report is an in-depth analysis detailing your home's value as well as a comparison with similar homes in the area
Home Values in the Area
Average Home Value in this Area
Purchase History
| Date | Buyer | Sale Price | Title Company |
|---|---|---|---|
| Lee David Don | -- | None Available | |
| Lee David Don | -- | None Available | |
| Lee Chang Teal Yat | -- | None Available | |
| Lee Don | -- | -- | |
| Lee Don | -- | -- | |
| Teal Lee Don | $354,500 | First American Title Guarant |
Source: Public Records
Mortgage History
| Date | Status | Borrower | Loan Amount |
|---|---|---|---|
| Open | Teal Lee Don | $283,505 |
Source: Public Records
Tax History Compared to Growth
Tax History
| Year | Tax Paid | Tax Assessment Tax Assessment Total Assessment is a certain percentage of the fair market value that is determined by local assessors to be the total taxable value of land and additions on the property. | Land | Improvement |
|---|---|---|---|---|
| 2025 | $8,346 | $555,407 | $166,167 | $389,240 |
| 2024 | $8,346 | $544,519 | $162,910 | $381,609 |
| 2023 | $8,065 | $533,844 | $159,716 | $374,128 |
| 2022 | $7,917 | $523,378 | $156,585 | $366,793 |
| 2021 | $7,742 | $513,117 | $153,515 | $359,602 |
| 2020 | $7,582 | $507,856 | $151,941 | $355,915 |
| 2019 | $7,651 | $497,900 | $148,962 | $348,938 |
| 2018 | $7,474 | $488,139 | $146,042 | $342,097 |
| 2017 | $7,296 | $478,570 | $143,179 | $335,391 |
| 2016 | $7,034 | $469,188 | $140,372 | $328,816 |
| 2015 | $6,899 | $462,141 | $138,264 | $323,877 |
| 2014 | $6,642 | $453,088 | $135,555 | $317,533 |
Source: Public Records
Map
Nearby Homes
- 5375 Singh Cir
- 5325 Singh Cir
- 32613 Singh Cir
- 32333 Crest Ln
- 32625 Brenda Way Unit 1
- 2469 Ascot Way
- 32226 Crest Ln
- 2716 Killdeer Ct
- 2544 Franklin Ave Unit 172
- 167 Kona Cir
- 2572 Parkside Dr
- 23 Palm Dr
- 30 Palm Dr Unit 30
- 192 Hawaii Cir
- 259 Molokai Cir Unit 259
- 328 Waikiki Cir
- 31274 Santa Maria Dr
- 33010 Lake Mead Dr
- 3501 Lake Ontario Dr
- 31959 Carroll Ave
- 1924 Abreu Way
- 1932 Abreu Way
- 32697 Colorburst Ct
- 32704 Colorburst Ct
- 1920 Abreu Way
- 1936 Abreu Way
- 1929 Abreu Way
- 1933 Abreu Way
- 1925 Abreu Way
- 1916 Abreu Way
- 1940 Abreu Way
- 32708 Mirabella Dr
- 32689 Colorburst Ct
- 32696 Colorburst Ct
- 1937 Abreu Way
- 1921 Abreu Way
- 32700 Mirabella Dr
- 1912 Abreu Way
- 1917 Abreu Way
- 1941 Abreu Way