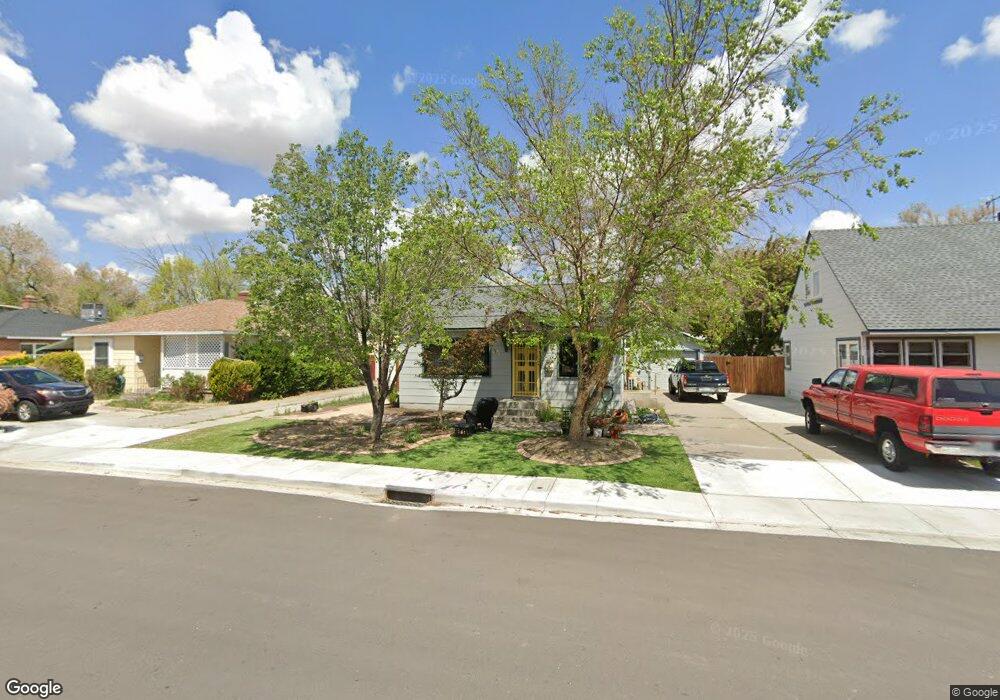
1928 G St Sparks, NV 89431
Downtown Sparks NeighborhoodEstimated Value: $271,573 - $336,000
1
Bed
1
Bath
624
Sq Ft
$478/Sq Ft
Est. Value
About This Home
This home is located at 1928 G St, Sparks, NV 89431 and is currently estimated at $298,143, approximately $477 per square foot. 1928 G St is a home located in Washoe County with nearby schools including Kate M Smith Elementary School, Sparks Middle School, and Sparks High School.
Ownership History
Date
Name
Owned For
Owner Type
Purchase Details
Closed on
Jun 17, 2004
Sold by
Avansino Norman J and Avansino Marie P
Bought by
Morgan Robin K
Current Estimated Value
Home Financials for this Owner
Home Financials are based on the most recent Mortgage that was taken out on this home.
Original Mortgage
$149,900
Outstanding Balance
$73,719
Interest Rate
6.09%
Mortgage Type
Unknown
Estimated Equity
$224,424
Create a Home Valuation Report for This Property
The Home Valuation Report is an in-depth analysis detailing your home's value as well as a comparison with similar homes in the area
Home Values in the Area
Average Home Value in this Area
Purchase History
| Date | Buyer | Sale Price | Title Company |
|---|---|---|---|
| Morgan Robin K | $150,000 | Ticor Title Of Nevada Inc |
Source: Public Records
Mortgage History
| Date | Status | Borrower | Loan Amount |
|---|---|---|---|
| Open | Morgan Robin K | $149,900 |
Source: Public Records
Tax History Compared to Growth
Tax History
| Year | Tax Paid | Tax Assessment Tax Assessment Total Assessment is a certain percentage of the fair market value that is determined by local assessors to be the total taxable value of land and additions on the property. | Land | Improvement |
|---|---|---|---|---|
| 2025 | $288 | $41,554 | $31,675 | $9,879 |
| 2024 | $288 | $37,587 | $27,860 | $9,727 |
| 2023 | $281 | $39,619 | $30,625 | $8,994 |
| 2022 | $278 | $29,965 | $22,680 | $7,285 |
| 2021 | $275 | $23,416 | $16,275 | $7,141 |
| 2020 | $267 | $22,828 | $15,820 | $7,008 |
| 2019 | $256 | $20,319 | $13,615 | $6,704 |
| 2018 | $251 | $16,625 | $10,220 | $6,405 |
| 2017 | $243 | $15,845 | $9,555 | $6,290 |
| 2016 | $237 | $13,738 | $7,420 | $6,318 |
| 2015 | $238 | $11,894 | $5,775 | $6,119 |
| 2014 | $231 | $9,593 | $3,815 | $5,778 |
| 2013 | -- | $8,410 | $2,730 | $5,680 |
Source: Public Records
Map
Nearby Homes