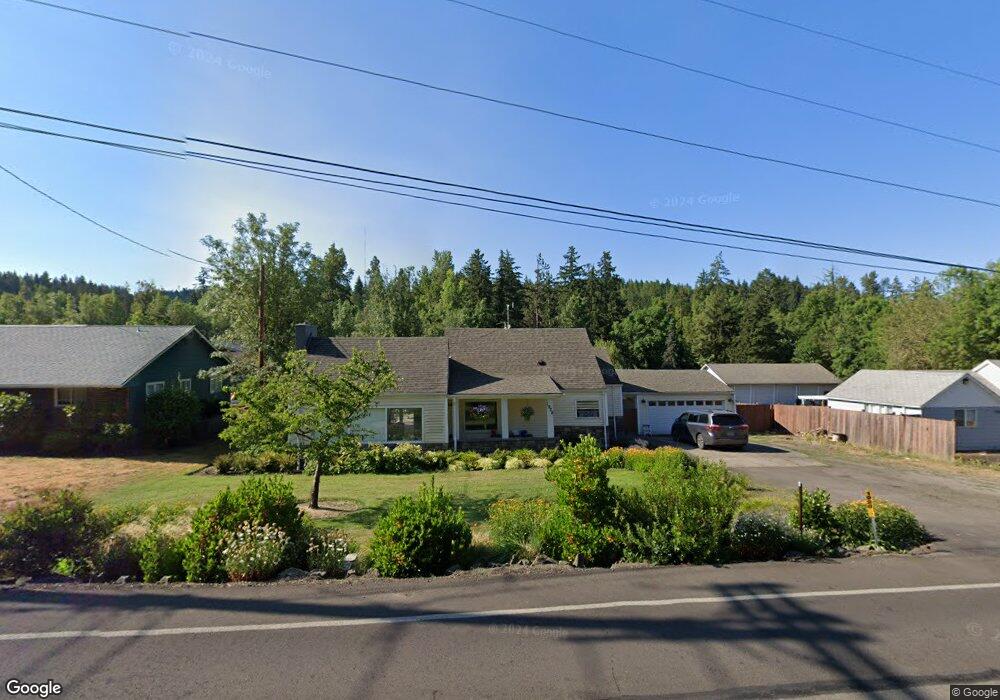
1928 Lorane Hwy Eugene, OR 97405
Estimated Value: $581,689 - $644,000
4
Beds
3
Baths
2,016
Sq Ft
$300/Sq Ft
Est. Value
About This Home
This home is located at 1928 Lorane Hwy, Eugene, OR 97405 and is currently estimated at $605,672, approximately $300 per square foot. 1928 Lorane Hwy is a home located in Lane County with nearby schools including Adams Elementary School, Arts And Technology Academy At Jefferson, and Churchill High School.
Ownership History
Date
Name
Owned For
Owner Type
Purchase Details
Closed on
Sep 22, 2014
Sold by
Ovens Sonny D
Bought by
Ovens Sonny D and Ovens Lindsey
Current Estimated Value
Home Financials for this Owner
Home Financials are based on the most recent Mortgage that was taken out on this home.
Original Mortgage
$230,000
Outstanding Balance
$75,673
Interest Rate
4.09%
Mortgage Type
New Conventional
Estimated Equity
$529,999
Purchase Details
Closed on
Jul 23, 2009
Sold by
Kestrel Company
Bought by
Ovens Sonny D
Home Financials for this Owner
Home Financials are based on the most recent Mortgage that was taken out on this home.
Original Mortgage
$299,475
Interest Rate
5.59%
Mortgage Type
FHA
Purchase Details
Closed on
May 19, 2008
Sold by
Gorilla Capital Of Lane County Llc
Bought by
Kestrel Co
Purchase Details
Closed on
May 8, 2008
Sold by
Mckern Misa
Bought by
Gorilla Capital Of Lane County Llc
Create a Home Valuation Report for This Property
The Home Valuation Report is an in-depth analysis detailing your home's value as well as a comparison with similar homes in the area
Home Values in the Area
Average Home Value in this Area
Purchase History
| Date | Buyer | Sale Price | Title Company |
|---|---|---|---|
| Ovens Sonny D | -- | Fidelity National Title Co | |
| Ovens Sonny D | $305,000 | Western Title | |
| Kestrel Co | $180,000 | None Available | |
| Gorilla Capital Of Lane County Llc | $163,837 | First American Title |
Source: Public Records
Mortgage History
| Date | Status | Borrower | Loan Amount |
|---|---|---|---|
| Open | Ovens Sonny D | $230,000 | |
| Closed | Ovens Sonny D | $299,475 |
Source: Public Records
Tax History Compared to Growth
Tax History
| Year | Tax Paid | Tax Assessment Tax Assessment Total Assessment is a certain percentage of the fair market value that is determined by local assessors to be the total taxable value of land and additions on the property. | Land | Improvement |
|---|---|---|---|---|
| 2024 | $4,391 | $314,281 | -- | -- |
| 2023 | $4,391 | $305,128 | $0 | $0 |
| 2022 | $4,184 | $296,241 | $0 | $0 |
| 2021 | $3,856 | $287,613 | $0 | $0 |
| 2020 | $3,900 | $279,236 | $0 | $0 |
| 2019 | $3,733 | $271,103 | $0 | $0 |
| 2018 | $3,304 | $255,541 | $0 | $0 |
| 2017 | $3,061 | $255,541 | $0 | $0 |
| 2016 | $2,920 | $248,098 | $0 | $0 |
| 2015 | $2,882 | $240,872 | $0 | $0 |
| 2014 | $2,784 | $233,856 | $0 | $0 |
Source: Public Records
Map
Nearby Homes
- 2203 Lorane Hwy
- 2030 W 34th Ave
- 0 Mclean Blvd Unit 24671448
- 0 Mclean Blvd Unit 697374759
- 3016 Ashley Loop
- 3046 Whitbeck Blvd
- 3010 Neslo Ln
- 2100 Shields Ave
- 0 W 40th Ave Unit 3 545854116
- 0 W 40th Ave Unit 3 639571582
- 0 W 40th Ave Unit 2 332352930
- 0 W 40th Ave Unit 2 100132422
- 2850 Garfield St
- 1895 W 28th Ave
- 1955 W 28th Ave
- 3160 Whitten Dr
- 879 Shalar Ct
- 2720 Fillmore St
- 00 Storey Blvd
- 0 Storey Blvd Unit 653467150
- 1950 Lorane Hwy
- 1890 Lorane Hwy
- 2000 Lorane Hwy
- 1785 Lorane Hwy
- 1780 Lorane Hwy
- 1775 Lorane Hwy
- 1792 W 34th Place
- 2060 Lorane Hwy
- 1765 Lorane Hwy
- 1915 Lorane Hwy
- 1772 W 34th Place
- 1755 Lorane Hwy
- 1762 W 34th Place
- 1760 Lorane Hwy
- 3445 Grant St
- 2043 Lorane Hwy
- 1752 W 34th Place
- 1781 W 34th Place
- 1745 Lorane Hwy
- 2071 Lorane Hwy