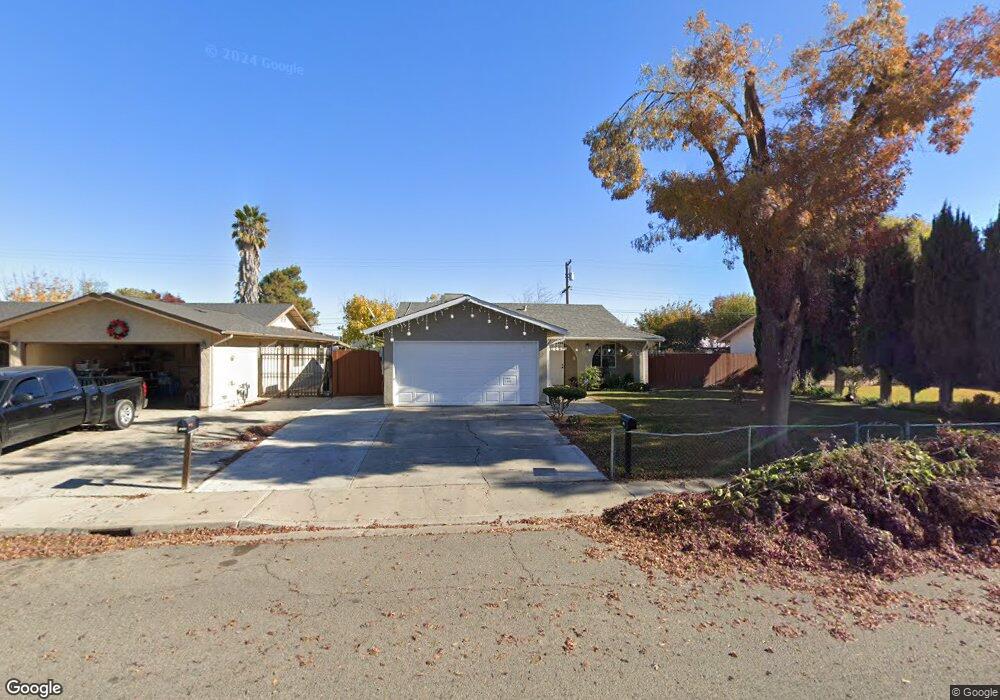
1928 T St Newman, CA 95360
Estimated Value: $320,000 - $394,000
3
Beds
2
Baths
1,234
Sq Ft
$299/Sq Ft
Est. Value
About This Home
This home is located at 1928 T St, Newman, CA 95360 and is currently estimated at $369,320, approximately $299 per square foot. 1928 T St is a home located in Stanislaus County with nearby schools including Orestimba High School.
Ownership History
Date
Name
Owned For
Owner Type
Purchase Details
Closed on
Apr 26, 2004
Sold by
Varner Carolyn L
Bought by
Diaz Mariano N and Diaz Virginia V
Current Estimated Value
Home Financials for this Owner
Home Financials are based on the most recent Mortgage that was taken out on this home.
Original Mortgage
$150,000
Interest Rate
6.29%
Mortgage Type
Purchase Money Mortgage
Purchase Details
Closed on
Mar 4, 2004
Sold by
Sanchez Dimas T and Sanchez Maria
Bought by
Varner Carolyn L
Home Financials for this Owner
Home Financials are based on the most recent Mortgage that was taken out on this home.
Original Mortgage
$150,000
Interest Rate
6.29%
Mortgage Type
Purchase Money Mortgage
Create a Home Valuation Report for This Property
The Home Valuation Report is an in-depth analysis detailing your home's value as well as a comparison with similar homes in the area
Home Values in the Area
Average Home Value in this Area
Purchase History
| Date | Buyer | Sale Price | Title Company |
|---|---|---|---|
| Diaz Mariano N | $200,000 | Chicago Title Company | |
| Varner Carolyn L | -- | -- |
Source: Public Records
Mortgage History
| Date | Status | Borrower | Loan Amount |
|---|---|---|---|
| Previous Owner | Diaz Mariano N | $150,000 | |
| Closed | Diaz Mariano N | $67,000 |
Source: Public Records
Tax History
| Year | Tax Paid | Tax Assessment Tax Assessment Total Assessment is a certain percentage of the fair market value that is determined by local assessors to be the total taxable value of land and additions on the property. | Land | Improvement |
|---|---|---|---|---|
| 2025 | $3,579 | $312,776 | $106,624 | $206,152 |
| 2024 | $3,488 | $306,644 | $104,534 | $202,110 |
| 2023 | $3,390 | $300,633 | $102,485 | $198,148 |
| 2022 | $3,335 | $294,739 | $100,476 | $194,263 |
| 2021 | $3,283 | $288,960 | $98,506 | $190,454 |
| 2020 | $2,552 | $227,500 | $100,000 | $127,500 |
| 2019 | $2,615 | $227,500 | $100,000 | $127,500 |
| 2018 | $2,262 | $207,000 | $100,000 | $107,000 |
| 2017 | $2,191 | $181,000 | $105,000 | $76,000 |
| 2016 | $1,911 | $175,000 | $50,000 | $125,000 |
| 2015 | $1,724 | $151,000 | $26,000 | $125,000 |
| 2014 | $1,330 | $116,000 | $20,000 | $96,000 |
Source: Public Records
Map
Nearby Homes
Your Personal Tour Guide
Ask me questions while you tour the home.