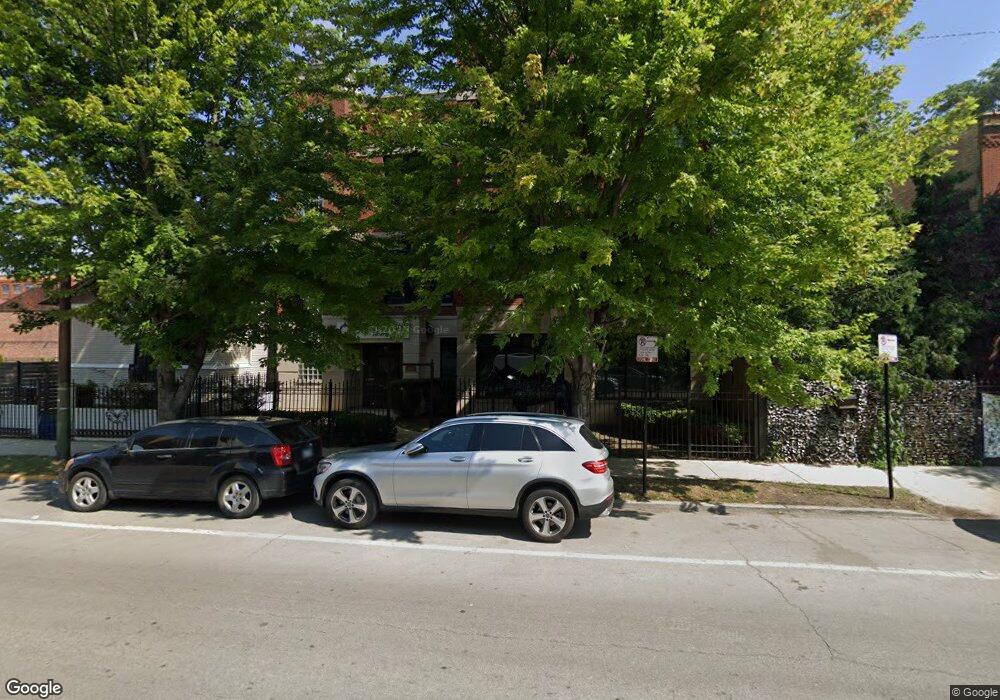
1928 W Fulton St Chicago, IL 60612
United Center Neighborhood
--
Bed
--
Bath
--
Sq Ft
0.71
Acres
About This Home
This home is located at 1928 W Fulton St, Chicago, IL 60612. 1928 W Fulton St is a home located in Cook County with nearby schools including Dett Elementary School, Wells Community Academy High School, and Chicago Jesuit Academy.
Ownership History
Date
Name
Owned For
Owner Type
Purchase Details
Closed on
Jan 24, 2020
Sold by
Azm 27 Llc
Bought by
Azm 27 Llc
Purchase Details
Closed on
Dec 5, 2019
Sold by
Frapoli Al and Woolsey Erik
Bought by
Miller Arthur and Azm 27 Llc
Purchase Details
Closed on
Jun 30, 2014
Sold by
Fulton Property Llc
Bought by
3 Story Properties Llc
Home Financials for this Owner
Home Financials are based on the most recent Mortgage that was taken out on this home.
Original Mortgage
$625,000
Interest Rate
5%
Mortgage Type
Commercial
Purchase Details
Closed on
Mar 21, 2012
Sold by
Sa Challenger Inc
Bought by
Fulton Property Llc
Home Financials for this Owner
Home Financials are based on the most recent Mortgage that was taken out on this home.
Original Mortgage
$589,500
Interest Rate
3.25%
Mortgage Type
Commercial
Purchase Details
Closed on
Nov 30, 2011
Sold by
Clarke Construction Llc
Bought by
Sa Challenger Inc
Purchase Details
Closed on
May 26, 2006
Sold by
City Of Chicago
Bought by
Clarke Construction Llc
Create a Home Valuation Report for This Property
The Home Valuation Report is an in-depth analysis detailing your home's value as well as a comparison with similar homes in the area
Home Values in the Area
Average Home Value in this Area
Purchase History
| Date | Buyer | Sale Price | Title Company |
|---|---|---|---|
| Azm 27 Llc | -- | None Available | |
| Miller Arthur | $1,675,000 | Chicago Title Insurance Co | |
| 3 Story Properties Llc | $1,250,000 | Chicago Title Insurance Co | |
| Fulton Property Llc | $555,000 | Freedom Title Corporation | |
| Sa Challenger Inc | -- | None Available | |
| Clarke Construction Llc | $70,000 | None Available |
Source: Public Records
Mortgage History
| Date | Status | Borrower | Loan Amount |
|---|---|---|---|
| Previous Owner | 3 Story Properties Llc | $625,000 | |
| Previous Owner | Fulton Property Llc | $589,500 |
Source: Public Records
Tax History Compared to Growth
Tax History
| Year | Tax Paid | Tax Assessment Tax Assessment Total Assessment is a certain percentage of the fair market value that is determined by local assessors to be the total taxable value of land and additions on the property. | Land | Improvement |
|---|---|---|---|---|
| 2024 | $35,911 | $196,308 | $23,040 | $173,268 |
| 2023 | $35,006 | $169,619 | $8,064 | $161,555 |
| 2022 | $35,006 | $169,619 | $8,064 | $161,555 |
| 2021 | $34,221 | $169,618 | $8,064 | $161,554 |
| 2020 | $30,118 | $134,748 | $8,064 | $126,684 |
| 2019 | $27,163 | $134,748 | $8,064 | $126,684 |
| 2018 | $26,704 | $134,748 | $8,064 | $126,684 |
| 2017 | $25,649 | $118,738 | $4,224 | $114,514 |
| 2016 | $23,782 | $118,738 | $4,224 | $114,514 |
| 2015 | $21,758 | $118,738 | $4,224 | $114,514 |
| 2014 | $15,300 | $82,462 | $4,224 | $78,238 |
| 2013 | $14,998 | $82,462 | $4,224 | $78,238 |
Source: Public Records
Map
Nearby Homes
- 1833 W Walnut St
- 2235 W Maypole Ave Unit 101
- 2058 W Washington Blvd
- 1812 - 1814 W Grand Ave
- 2035 W Race Ave
- 2049 W Race Ave
- 2055 W Race Ave
- 2059 W Race Ave
- 530 N Wood St Unit D
- 2002 W Ohio St
- 466 N Paulina St Unit 202
- 466 N Paulina St Unit PH-402
- 466 N Paulina St Unit 201
- 466 N Paulina St Unit PH-403
- 504 N Paulina St
- 2257 W Lake St Unit 101
- 1819 W Erie St
- 2059 W Erie St
- 512 N Leavitt St
- 518 N Leavitt St Unit 3
- 1928 W Fulton St Unit 3F
- 1928 W Fulton St Unit 2R
- 1934 W Fulton St
- 1924 W Fulton St
- 1937 W Fulton St
- 1948 W Carroll Ave
- 1901 W Carroll Ave
- 1956 W Walnut St
- 1950 W Carroll Ave
- 1863 W Carroll Ave Unit 65
- 229 N Damen Ave
- 1855 W Carroll Ave
- 1937 W Walnut St
- 1848 W Walnut St
- 1846 W Walnut St
- 1859 W Walnut St
- 1839 W Fulton St
- 1842 W Walnut St
- 1837 W Fulton St
- 1837 W Fulton St