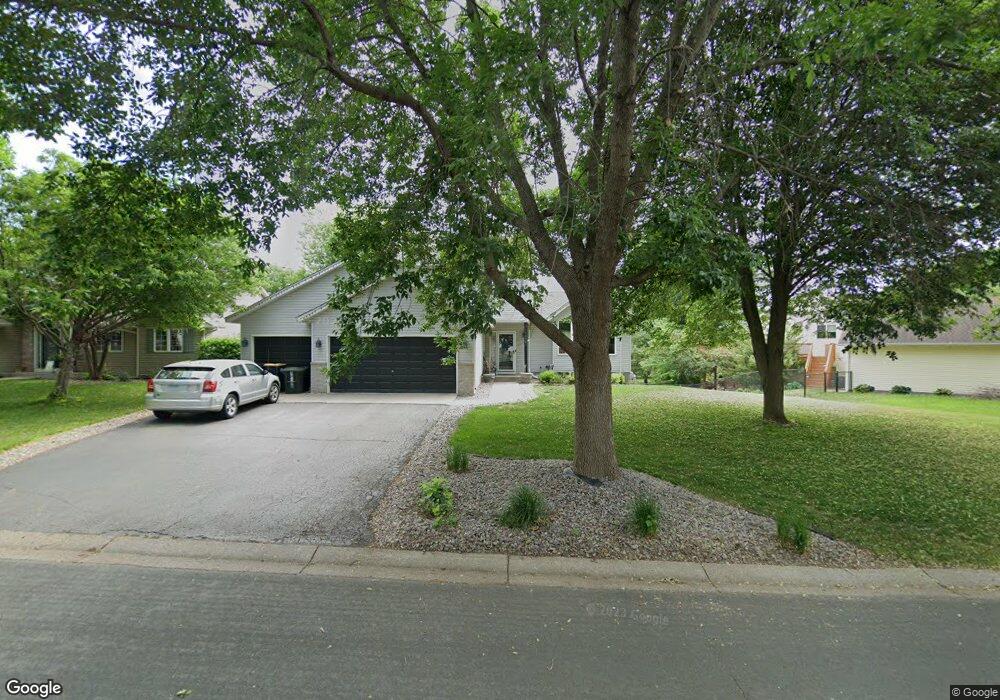
19281 Evenston Dr Farmington, MN 55024
Estimated Value: $469,000 - $487,000
3
Beds
4
Baths
1,793
Sq Ft
$265/Sq Ft
Est. Value
About This Home
This home is located at 19281 Evenston Dr, Farmington, MN 55024 and is currently estimated at $475,136, approximately $264 per square foot. 19281 Evenston Dr is a home located in Dakota County with nearby schools including Meadowview Elementary School, Robert Boeckman Middle School, and Farmington High School.
Ownership History
Date
Name
Owned For
Owner Type
Purchase Details
Closed on
Dec 16, 2019
Sold by
Vanhorn Corey E and Vanhorn Van Horn
Bought by
Vancleve Benny and Turner Kelly
Current Estimated Value
Home Financials for this Owner
Home Financials are based on the most recent Mortgage that was taken out on this home.
Original Mortgage
$338,751
Outstanding Balance
$298,775
Interest Rate
3.62%
Mortgage Type
FHA
Estimated Equity
$176,361
Purchase Details
Closed on
May 30, 2002
Sold by
Ploeger Sean M and Ploeger Holly A
Bought by
Vanhorn Corey J and Vanhorn Sherry M
Purchase Details
Closed on
May 23, 1997
Sold by
The Windwood Company Inc
Bought by
Ploeger Sean M and Ploeger Holly A
Purchase Details
Closed on
Feb 4, 1997
Sold by
Builders Development Inc
Bought by
The Windwood Company Inc
Create a Home Valuation Report for This Property
The Home Valuation Report is an in-depth analysis detailing your home's value as well as a comparison with similar homes in the area
Home Values in the Area
Average Home Value in this Area
Purchase History
| Date | Buyer | Sale Price | Title Company |
|---|---|---|---|
| Vancleve Benny | $345,000 | Trademark Title Services Inc | |
| Vanhorn Corey J | $264,000 | -- | |
| Ploeger Sean M | $180,208 | -- | |
| The Windwood Company Inc | $35,900 | -- |
Source: Public Records
Mortgage History
| Date | Status | Borrower | Loan Amount |
|---|---|---|---|
| Open | Vancleve Benny | $338,751 |
Source: Public Records
Tax History Compared to Growth
Tax History
| Year | Tax Paid | Tax Assessment Tax Assessment Total Assessment is a certain percentage of the fair market value that is determined by local assessors to be the total taxable value of land and additions on the property. | Land | Improvement |
|---|---|---|---|---|
| 2024 | $5,086 | $423,100 | $94,100 | $329,000 |
| 2023 | $5,086 | $417,700 | $94,200 | $323,500 |
| 2022 | $4,932 | $421,900 | $91,100 | $330,800 |
| 2021 | $4,770 | $350,600 | $79,300 | $271,300 |
| 2020 | $4,598 | $337,400 | $75,500 | $261,900 |
| 2019 | $4,627 | $314,400 | $71,900 | $242,500 |
| 2018 | $4,351 | $310,400 | $68,500 | $241,900 |
| 2017 | $4,286 | $285,200 | $65,200 | $220,000 |
| 2016 | $4,092 | $273,800 | $62,100 | $211,700 |
| 2015 | $3,727 | $241,582 | $56,665 | $184,917 |
| 2014 | -- | $232,099 | $52,506 | $179,593 |
| 2013 | -- | $209,100 | $46,446 | $162,654 |
Source: Public Records
Map
Nearby Homes
- 19158 Everest Path
- 19325 Everfield Ave
- 19298 Evening Star Way
- 19432 Everfield Ave
- 19313 Everfield Ave
- 19380 Everglade Path
- 19440 Everglade Path
- Ivy Plan at Meadowview Preserve
- Linwood Plan at Meadowview Preserve
- Continental Plan at Meadowview Preserve
- Waverly Plan at Meadowview Preserve
- Mercer Plan at Meadowview Preserve
- 19410 Everglade Path
- 19461 Everglade Path
- 19265 Everfield Ave
- 19241 Everfield Ave
- The Spruce Plan at Meadowview Preserve - Main-Level Living Villa Homes
- 19499 Everfield Ave
- The Sycamore Plan at Meadowview Preserve - Main-Level Living Villa Homes
- The Cedar Plan at Meadowview Preserve - Main-Level Living Villa Homes
- 19275 Evenston Dr
- 19285 Evenston Dr
- 19269 Evenston Dr
- 19289 Evenston Dr
- 19221 Everest Path
- 19282 Evenston Dr
- 19235 Everest Path
- 19280 Evenston Dr
- 19173 Everest Trail
- 19286 Evenston Dr
- 19276 Evenston Dr
- 19274 Evenston Dr
- 19263 Evenston Dr
- 19293 Evenston Dr
- 19270 Evenston Dr
- 19181 Everest Trail
- 19268 Evenston Dr
- 19292 Evenston Dr
- 19264 Evenston Dr
- 5997 193rd St W